


On October 15th, 2017, the United States’ National Oceanic and Atmospheric Administration (NOAA) published a map of wind speed probabilities associated with Hurricane Ophelia’s imminent landing on Ireland and the British Isles (figure 1). That a tropical storm had grown to hurricane strength in the otherwise cold waters of the north Atlantic was unusual enough, but NOAA’s map was strange as well. It cut off its predictions abruptly at 60°N and a few degrees past the meridian, giving the impression that the storm had somehow broken the weather forecast. According to NOAA meteorologist Michael Brennan, this glitch was a computing programming failure, rather than the wind’s obeisance to the imaginary topography of latitude and longitude.1 While NOAA’s supercomputing cluster performed the requisite calculations for the missing area, its visualization functions only accounted for an arbitrarily defined grid. Furthermore, NOAA’s scientists didn’t know the grid’s precise range until Ophelia’s unusual force and location tested it. While NOAA was able to tweak its program to produce a corrected map, the original glitched map provides an object lesson in the computational nature of contemporary weather prediction.2
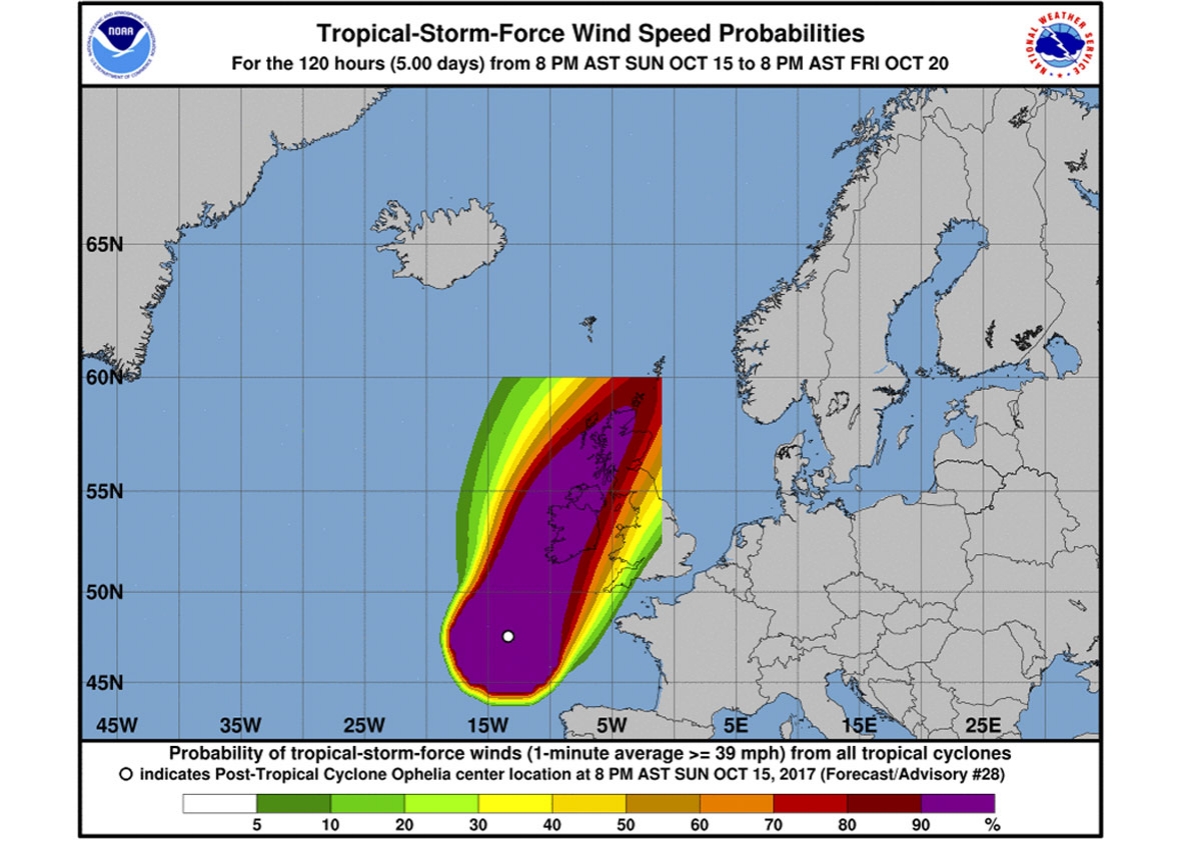
Fig 1. NOAA’s glitched map for Hurricane Ophelia.3
Improvements in weather prediction over the twentieth century are intimately entangled with digital media. The weather map that you glance at each morning is the outcome of a long chain of computational operations, from sensing satellites to cloud computing infrastructures, all together quantifying and visualizing planetary phenomena. To borrow an insight from Shannon Mattern, these technologies perceive the world as “code-space,” a mesh of spatial and contextual data.4 Our understanding of the planet itself derives from the insights these technologies develop. Weather maps, like any maps, are cultural objects that reflect and condition how we see the planet as a planet—and ourselves in relation to it. Their predictions derive from massive quantities of atmospheric data. From these data, contemporary meteorologists produce and maintain complex models of virtual atmospheres that swirl on servers across the globe. In turn, these models help meteorologists and climate scientists extrapolate predictions and develop insights into our planet’s history. What the Ophelia glitch suggests, and what I investigate in this paper, is that we can analyze the material and political consequences of computation in weather prediction by attending to the media techniques that meteorologists use to wrangle such data and translate them into useful forecasts.
I’ll explore one technique in particular: the grid, a figure that cuts across code, cartography, and culture. Grids are central to meteorology’s transformation from a holistic art to a numerical and theoretical science. They facilitate data collection through satellite placement, the processing of data into virtual models, and weather’s representation in visual media. Grids are more than cartographic artifacts. They are, as Bernhard Siegert suggests, crucial media of control, linking “the concept of place” to “the notion of order.”5 Extending Siegert’s analysis, I argue that grids facilitate connections between physical space and virtual computation, such that the planet and its models can be considered conceptually equivalent for the purposes of the forecast. Furthermore, grids provide an epistemological justification for the further subordination of physical space to computational control. After all, in order for the forecast to be as accurate as possible, one needs as much data as one can get. Grids are then central to the cultural work of weather prediction.
In this way, grids are key to understanding how weather predictions operate as media. Here I draw from John Durham Peters’ insight that media “regulate traffic between nature and culture,” both in the sense of information moving between the two, as well as how media determine the very categories of “nature” and “culture” themselves.6 Drawing from Peters, we might say that media are more than devices: they are interpretive frameworks for understanding and shaping the planet. The strange case of NOAA’s glitched map then indexes a set of problems for the prediction and representation—the mediation—of weather phenomena. Extreme weather events such as Ophelia increasingly defy the very technological models that seek to represent and constrain them. Given how these models are key to the prediction of increasingly common crises, their failure can have a snowball effect, piling up inconsistencies between real and virtual worlds that have material consequences for life on our planet.
By telling the story of the grid in weather prediction as one of mediation, I join a growing community of scholars interested in how digital media manage the planet and our lives on it. This field works to develop what Nicole Starosielski has usefully called an “environmental consciousness [in] the study of digital systems.”7 For Starosielski, we come to this consciousness through an analysis of the social and material infrastructures that undergird mediatized life. This works both ways: just as we might seek the environmental beneath technical infrastructure, those same infrastructures set the terms for what we mean by “environmental” in the first place. Media are central to this translation. As Jussi Parikka argues, “it is through and in media that we grasp earth as an object for cognitive, practical, and affective relations” (italics mine).8 I want to zero in on this “grasping earth,” which I read as both “understanding” and “controlling.” As a technique both of visualization and datafication, grids are central to this project. Weather forecasting is then more than just an attempt to guess the rain next week. It is a media technology that extends computation across the surface of the entire planet. No wonder then that tensions around grids, borders, and other techniques of geopolitical control flare up in moments of climatological crisis.
To put my argument succinctly: grid techniques enable weather prediction to make equivalent real atmospheres and virtual models, further enabling computation’s conceptual and material control over the planet itself. I’ll address this in three moves. First, I begin with a media theoretical discussion of grid techniques in weather prediction. Here I draw chiefly from the Kulturtechniken or “cultural techniques” school of contemporary German media theory. By reading weather prediction through this field’s insights, I establish the grid as a media technique for linking visual representation, mathematical processing, and geopolitical order. With this theoretical toolkit in hand, I then trace the emergence of the grid in early numerical weather prediction. I focus on British physicist Lewis Fry Richardson’s 1922 treatise Weather Prediction by Numerical Process, the first sustained attempt at developing a program for computational weather prediction. For Richardson, grids become crucial for translating physical space into computable equations. Consequently, grids facilitated the labor of computation such that the difficult and large-scale problems of wrangling weather data became computational at all. Finally, I return to the Ophelia glitch to examine how grids respond to moments of ecological crisis. Grids efface the widening gap between real and virtual space, and weather prediction emerges as a key technology for the continual subordination of the planet to regimes of computability. I end with a postscript that projects these questions into slightly more immediate terrain, as I ask what happens to these data collection and processing infrastructures when their state-level support collapses, as happened during the 2018–19 United States government shutdown.
Grid Techniques
When the howl of an oncoming storm rises in the distance, or walls begin to crack under a summer heatwave, or a tidal swell engulfs a city’s metro system, the weather can seem all too immediate, felt with one’s body in the instant of impact. An extreme weather event seems to dissolve the technical retaining wall between the built environment and its natural “outside.” Yet as Christian Andersen and Søren Bro Pold argue, our collective purchase on the weather also depends on the proliferation of digital sensors, networked supercomputers, and a range of technical interfaces.9 Through these technical infrastructures, we develop visualizations of and predictions for weather conditions, as well as the long-ranging climate models in which we situate such conditions. These technologies are rarely visible to the average citizen, but rather take the form of digital sensors, satellites, and black-boxed algorithms. They are what Judd Case terms “logistical media,” which “intrude, almost imperceptibly, on our experiences of space and time, even as they represent them.”10 Janine Randerson notes that logistical media are challenging to analyze, as they both generate data as well as constitute the conditions for data’s later representation.11 Like the weather, they are simultaneously present and absent. As is true of many infrastructures, we glimpse them best in moments of breakdown.
We are each familiar with the tension between the weather’s “immediacy” and its technical mediations. Each time a forecast disagrees with our lived reality, as Sara Grossman notes, we magnify this growing “dissociation.”12 Paul Edwards characterizes these slippages as part of the necessary “friction” of weather forecasting.13 Forecasting is not a smooth enterprise. It features social and material choke points that constrain its fluidity and accuracy. “Friction” is a useful metaphor not just for its poetry, but for how it directs our attention to the physicality of the enterprise itself. After all, media are material. We can only blanket the planet with so many sensors, calibrated at so fine a point; we can only transmit, store, and process data at the limits of our physical (and financial) capacities; and despite our best efforts, theorizing atmospheric flow still tests even our most sophisticated computers. Physical friction engenders social friction, as meteorologists negotiate supply chains of data processing, to say nothing of the challenges of communicating and collaborating across borders and languages. For the forecast to do its job, it must efface this friction. We need to believe that its virtual predictions correspond to real experiences.
As a technique of visualization and organization, the grid becomes central to negotiating this effacement. Grids are both material and conceptual structures. Materially, grids are drawn lines in space that organize things, whether the points of a classic Cartesian grid, the architecture of a cubicle farm, or territories on a map. Conceptually, grids link different kinds of knowledges together. Take the Cartesian grid. By plotting points on X and Y axes, algebraic relations become geometrical and vice versa. With enough experience and familiarity with the Cartesian grid, one sees different kinds of mathematical relation as visual structures, and the presence of different kinds of lines and curves clues one in to underlying mathematical abstractions. On the grid, there is no difference between seeing and organizing, mapping and ordering.
I want to offer some contextual remarks on what it means to call the grid a “technique,” rather than as another logistical media technology or system of visual representation. In approaching this work through the frame of technique, I follow German media theorist Bernhard Siegert’s work on Kulturtechniken, or “cultural techniques.” While a full study of cultural techniques exceeds my scope here, the term is just enough jargon to require some definitional context.14 The term originates in German agricultural practice in the nineteenth-century, where it referred to what Geoffrey Winthrop-Young describes as “large-scale amelioration procedures such as irrigating and draining arable tracts of land, straightening river beds, or constructing water reservoirs.”15 These are projects that intervene directly into the earth itself. The term stayed largely confined to agro-engineering communities throughout the twentieth century until media scholars recuperated it in the 1990’s and 2000’s.16 At present, theories of cultural techniques extend and revise Friedrich Kittler’s argument that media technologies constitute the a priori of culture to hold that techniques—strategies, operations, patterns of use, and conceptual activities—generate cultural distinctions as such.17 To quote Siegert, “humans as such do not exist independently of cultural techniques of hominization, time as such does not exist independently of cultural techniques of time measurement, and space as such does not exist independently of cultural techniques of spatial control” (italics in original). 18 We can develop an example from the word’s original sense: the presence of the abstract idea of “civilization” does not drive a town to straighten a riverbed; rather, the cultural techniques of agriculture have material impacts on the terrain that produce the categories of “town,” “nature,” “civilized,” and “uncivilized.” In the words of Cornelia Vismann, another prominent contributor to this tradition, “the agricultural tool determines the political act; and the operation itself produces the subject, who will then claim mastery over both the tool and the action associated with it.”19
The advantage of thinking with cultural techniques is not to solve, once and for all, the chicken or egg question of from whence media arise. As Liam Cole Young has shown, cultural techniques share familiar resemblances with earlier Anglophone arguments about technical media’s role in civilizational change, including those of Lewis Mumford and Harold Innis.20 We might also critique the term’s interest in categorization, particularly its investment in the concepts of “nature” and “culture,” which Donna Haraway has argued are best thought of as one term, “natureculture,” inseparably bound and indissoluble.21 What new insights do cultural techniques then bring us? For my purposes, cultural techniques offer a compelling frame for thinking about the practices of collecting, sorting, organizing, and processing data. They open a window on weather forecasting as an infrastructural technology not only in the sense that it entails literal massive technical armatures—cables, satellites, buildings, legal support structures, the list goes on—but also as a continual negotiation between human, technology, and planet.
For Siegert, grids establish relationships between vision, computation, and subjectivity.22 These three operations constitute the grid’s major operative functions. First, in their most familiar senses, grids are “imaging technologies” that translate three-dimensional space into two-dimensional representations. These are the grids of map projections and fixed-point perspective, which offer ways to envision space on the flat media of paper or canvas. Second, grids are technologies of data storage and retrieval. On a grid, individual points have locations and addresses that allow their later identification. As Abelardo Gil Fournier notes, this quality allows grids to establish “fundamental separation[s] between data and address[es].”23 Put another way, on a grid, a thing and its location are discrete; there is no meaningful connection between the two but the temporary logic imposed by the grid. As such, grids are powerful tools for colonial operations, which Gil Fournier notes depend on disarticulating land from its pre-existing context, such that it might become available to conquest.
These first two senses, visual and mathematical, combine, in Siegert’s words to “constitute a world of objects imagined by a subject.”24 This is the grid’s fundamental operation as a cultural technique: it gives rise to subject and object positions. Under the regime of the grid, the world itself becomes available to parsing, division, and manipulation—all operations characteristic of data. The implicit subject position of contemporary weather prediction is then not human, but rather machine. Computational weather prediction relies on vast quantities of data; as such, it also requires ongoing processes that translate atmospheric phenomena into information. To return to Mattern’s earlier idea of code-space, the proliferation of sensing technologies further multiplies the number of “intelligences” visualizing and interpreting the world. For such a technical intelligence like a weather satellite to produce meaningful insights, it requires an ongoing translation between the external “real” world and its virtual models. Like Randerson’s observations on logistical media, grid techniques are both the substance and structure of that translation.
One key modification that thinking with cultural techniques permits is the decoupling of this mechanized and datafied subject position from computing technologies as such. In doing so, we can dispense with a supposed dualism between analog, sympathetic humans and digital, unfeeling machines. As Siegert demonstrates, grids have long facilitated discrete operations, from land speculation to prison planning.25 Grids produce a computational imagination that precedes digital computation. Moreover, in the case of extreme weather events, this mechanized subjectivity has political consequences for life during and in the aftermath of disaster. We know our disasters by their individual names: Ophelia, Sandy, Fukushima. Their legibility as events becomes key not only to their prediction, but also the management of their fallout. Rob Nixon’s concept of “biological citizenship” is useful here, as establishing one’s relationship to the bounded “thing” of a disaster allows one access to governmental amelioration resources, for instance—and failing to establish such a connection cuts one off from much-needed aid.26 As I’ll discuss in the next section, grids are crucial to this history of imagining the weather as a thing, which in turn subordinates the weather to a human political regime.
Weather Prediction by Numerical Process
“It would be safe to say that a particular disposition of stars, planets, and satellites never occurs twice,” writes British mathematician Lewis Fry Richardson in his 1922 book Weather Prediction by Numerical Process, “[w]hy then should we expect a present weather map to be exactly represented in a catalogue of past weather?”27 Here Richardson refers to extant techniques of weather prediction in the early twentieth century. Then, meteorology was an archival rather than computational endeavor. Forecasters compared current weather conditions to historical maps and data, assuming that past performance would guarantee future results. Weather prediction was the art of pattern recognition. While these approaches were moderately accurate, Richardson notes that they were neither useful for predictions more than a few days out, nor a step forward in an overall theoretical understanding of the atmosphere.28 In Weather Prediction, the first sustained attempt at developing techniques for numerical weather forecasting, Richardson rejects this archival approach. Instead, he offers computational methods designed to extrapolate future weather conditions from present weather data.
Weather Prediction documents Richardson’s attempts in the late 1910’s to reconstruct post facto the forecast in central Germany on May 20th, 1910, using only numerical methods. Underneath reams of equations and tables, Richardson offers a speculative vision for translating the planet into data and techniques for managing such data’s exponential growth. While his ultimate predictions were far off the mark and his techniques gained little traction in his own lifetime, contemporary meteorologists have shown that his methods were fundamentally sound.29 Grid techniques are core to these methods. Through grids, Richardson schematizes the atmosphere, rendering it available to partition, calculation, and re-composition. The grid’s practical innovations influence computational weather prediction down to the present day. Furthermore, Richardson’s chronological distance from the emergence of digital computation as such offers an opportunity to focus on the conceptual techniques that will underpin subsequent decades of computational weather prediction.
The chief innovation of modern weather prediction is learning to see the weather as data. The nineteenth century saw a rising interest in weather data collection as part of a broader attempt to concretize meteorology as a theoretical science alongside biology and physics.30 At first, these data were textual, reminiscent of historical weather diaries.31 Data collectors would package up their diaries and mail them back to a central command—a lengthy and tedious process that made it difficult to get a snapshot of atmospheric conditions across a broad terrain at a single moment. The advent of electric telegraphy changed the game, making it possible to transmit data rapidly across wider distances. The United States and European nations became interested in collecting weather data for use in both agricultural and military forecasts.32 As these data grew in scale and complexity, scientists and governments alike struggled to develop techniques for their management and interpretation. As Caren Kaplan argues, a state’s assertion of control over a territory depends on its ability to perceive its holdings as a territory, as contiguously unified under a central power.33 The “bird’s eye” or atmospheric perspective offered by weather data was central to this political imagination. Data collected in diaries and transmitted over telegraph wires fueled maps that, like the Ophelia map, ushered the atmosphere into a political and visual regime. Still, the scope of these data soon outpaced meteorologists’ and cartographers’ abilities to parse them in real time. This temporal issue led to the demand for new theoretical techniques for weather data management and prediction.
The central challenge to a purely theoretical meteorology is the fiendish complexity of atmospheric systems. One has to account for changes in temperature, humidity, velocity, altitude, topography, and more—and on a global scale to boot. Managing all of these variables still tests our contemporary supercomputers. The first attempts at sketching out these theoretical relationships date back to the late 1890’s, when Norwegian physicist Vilhelm Bjerknes published a series of papers outlining connections between fluid and thermodynamics now regarded in meteorology as the “primitive equations.”34 These equations were the first conceptual models of climate systems. While they are now heralded as transformative for meteorology, solving them in practice ran into a number of roadblocks. The primitive equations are differential equations, in that they theorize relationships between rates of change as a function of another variable. Solving differential equations by hand not only tested the conceptual tools available to Bjerknes and his fellow mathematicians, but ran into a crucial limiting factor: the weather happened faster than the scientists could solve the equations. It would be more practical to simply wait to see what the weather would do rather than try to predict it.
Undeterred, meteorologists in the 1910’s and 1920’s devised a number of alternative techniques to overcome this central material limit to their work. Many of these techniques relied on graphical media to approximate or simplify the calculus associated with the primitive equations. Ironically, Bjerknes himself was on the forefront of this shift toward “descriptive meteorology,” as Edwards terms it. Though a Norwegian national, Bjerknes was living in Germany at the start of World War I. The German government drafted him and his team to produce forecasts that might shift the tide of a war that relied heavily on aerial combat.35 At first, Bjerknes used physical computing media such as nomograms and slide rules to approximate solutions to his equations. As the pace of the war quickened, he abandoned his equations entirely and turned instead to cartographic analysis. These techniques returned to weather maps, albeit not in the same spirit of pattern recognition as archival forecasting. Rather, Bjerknes developed a method of air mass analysis, wherein he read possible weather events from the collision of discontinuous “fronts” of hot and cool air. These strategies, which later became characteristic of Bjerknes’ “Bergen School” of meteorology, are familiar to anyone who’s ever watched a television forecast today.
Richardson, however, maintained that a purely theoretical meteorology would deliver more accurate and dependable forecasts over longer periods of time. In returning to the primitive equations, he sought to reduce their complexity such that they might produce useful, if approximate forecasts with a more reasonable work schedule. Rather than deploy cartographic methods, as Bjerknes came to favor, Richardson “thought it better to proceed by numerical tables.”36 His innovation was this: while continuous differential equations took too long to solve to be practical, mathematicians could solve discontinuous algebraic equations much quicker and reliably. Think of the classic calculus problem of solving the area underneath a curve. One can approach this problem using calculus, certainly. But one might also reduce the curve to a series of points, turning a single curve into many smaller lines. One can solve for the area underneath all of these “chunks” with relative ease, and then add them all back together as an approximation of the area under the original curve. Richardson applied the same logic to the primitive equations, replacing them with finite-difference equations. While the time and energy that went into solving Richardson’s equations were not inconsiderable – working alone, it took him about six weeks to prepare the initial calculations – they were nevertheless a considerable improvement by the standards of computing power available in the 1920’s.37

Fig 2. The frontispiece to Weather Prediction by Numerical Process, showing a grid blanketing continental Europe.38
To achieve this transformation from differential to finite-difference equations, Richardson employs grid techniques. These techniques not only “chunked” the work of calculation, but also the terrain of the planet itself. Weather Prediction’s frontispiece provides a map for his vision of a computational planet (figure 2). A checkerboard grid extends over Western Europe and, by extension, the rest of the globe. In each square’s center, Richardson imagines a dedicated meteorological station. The black squares take pressure observations and the white squares velocity. This allows them to distribute the overall computational work of the primitive equations across many stations, with no one station tasked with the whole equation. The names of each squares correspond to cities that Richardson supposes might be geographically well-suited to data collection. Where the grid spans the ocean, Richardson provides two names, proposing that two stations interpolate their data together. Individual stations would then send their measurements and partial calculations back to a central hub, where they would be assembled together into one forecast. The grid here serves two functions: first, to carve the atmosphere into smaller subsections; and second, to carve the equations themselves into discrete algebraic parts. As such, the grid facilitates not only the partition of geographic space, but also of space’s mathematical models. The planet gets broken down into parts and later reassembled into a parallel model.
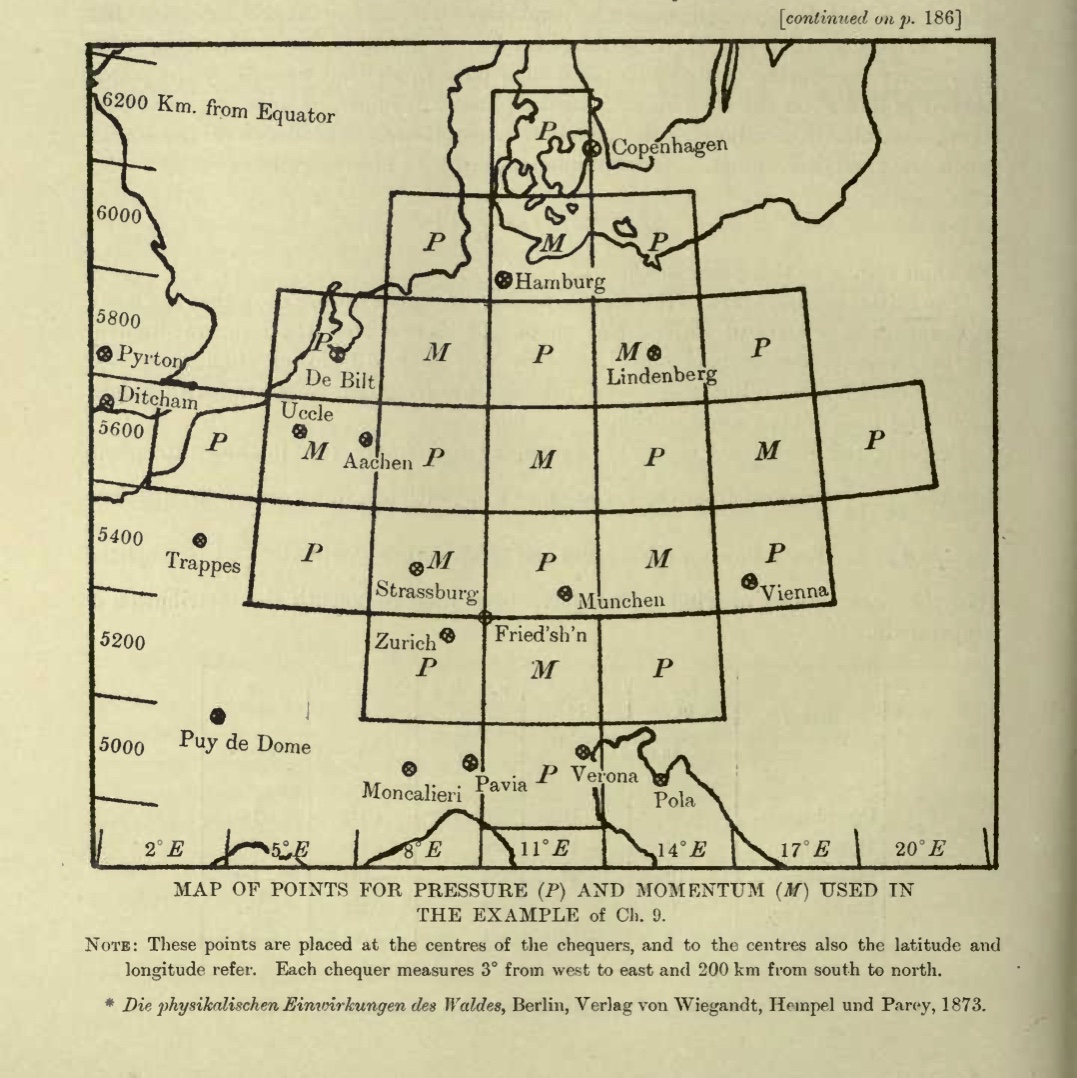
Fig 3. A map at higher “resolution,” showing Richardson’s grid for central Germany.39
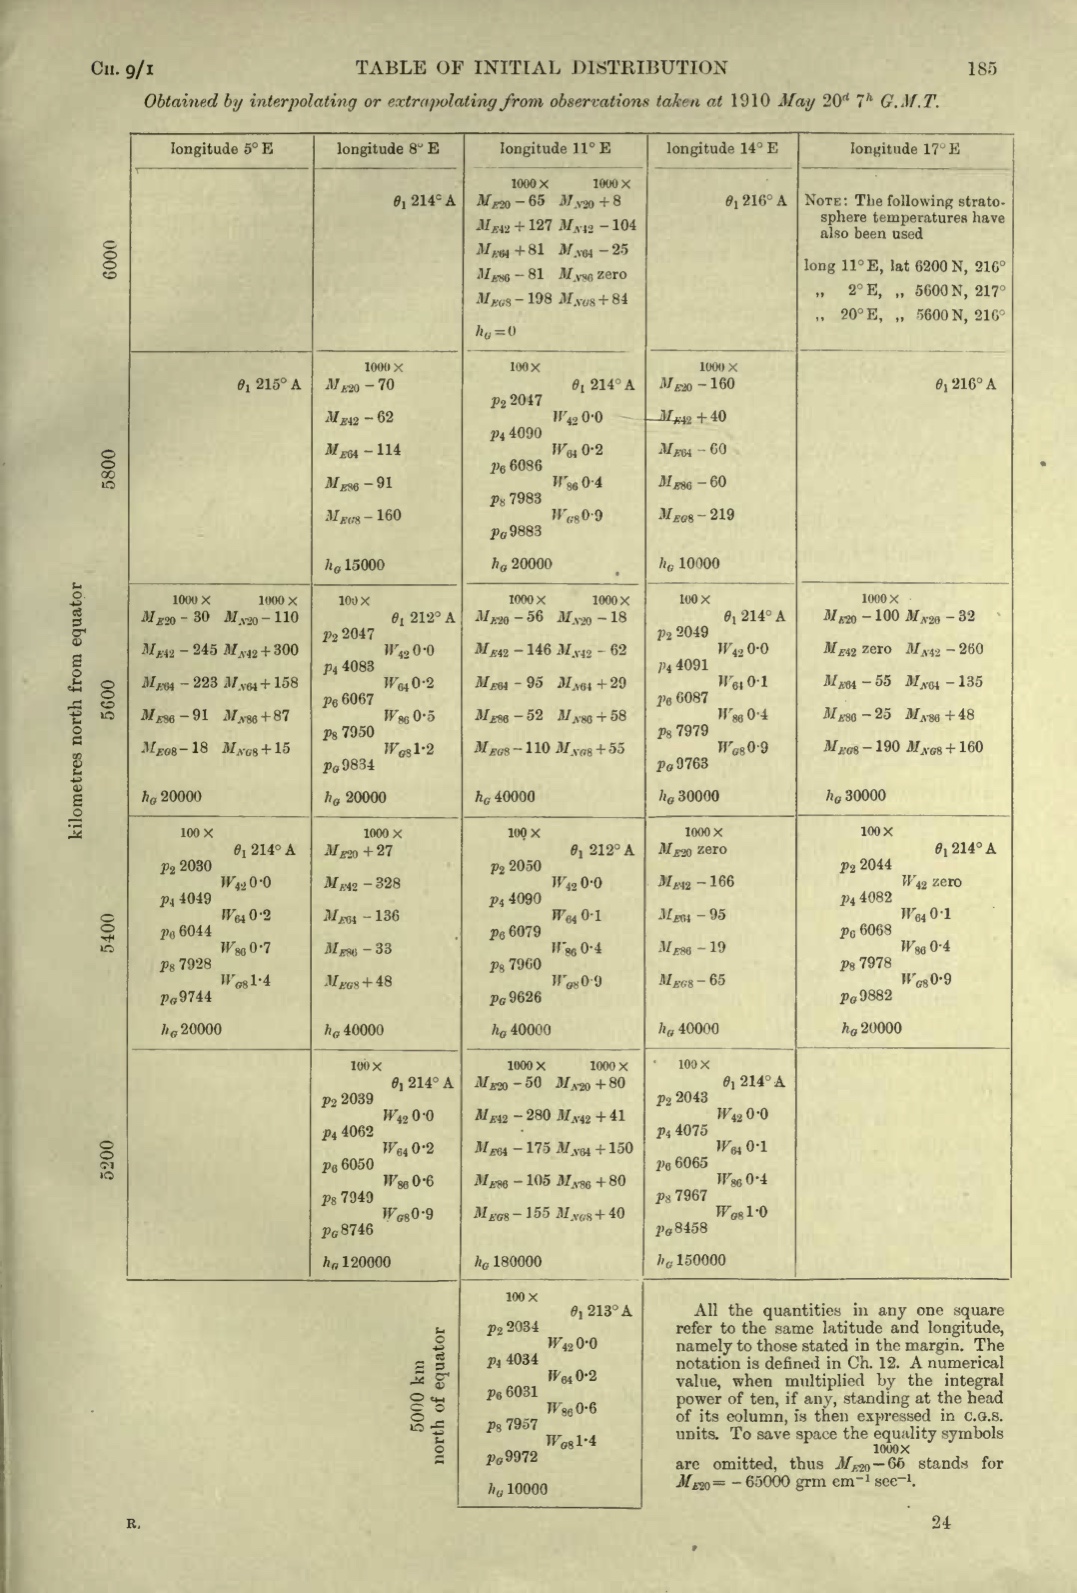
Fig. 4: The table corresponding to the map in figure 3.40
The grid operates as a formal technique that facilitates equivalences between two different kinds of diagrams, the map and the table. It’s an almost unremarkable operation, but one that’s crucial to the development of computational weather prediction. We can see this movement play out in figures 3 and 4, which zero in on the few hundred square kilometers in Germany for which Richardson attempts to reconstruct a forecast. Figure 3 follows the same pattern as figure 2, although at a much higher “resolution,” with smaller squares. In figure 4, Richardson translates the gridded map into a preliminary table of atmospheric measurements extrapolated or interpolated from initial data collected on May 20th, 1910 (coincidentally collected by Bjerknes during a ballooning mission). Through the grid, Richardson first translates the planet from a three-dimensional space to a two-dimensional representation, and then further from a representation into a rudimentary database. Moreover, these data points are themselves virtual. Richardson wanted measurements from the exact centers of each square, but the data ranged from all over Germany. Hence the “extrapolation or interpolation” of his caption, as Richardson had to massage the initial data to fit his grid’s geographical structures. From the very first moments of his project, and of numerical weather prediction more generally, Richardson has produced a virtual planet imagined to have direct correspondence to our real one.
Grids also help Richardson manage the physical labor of calculation. Today, the word “computer” summons visions of laptops and mobile phones, or perhaps, with a retro bent, room-sized mainframe supercomputers. Recent work in environmental media studies has attended to ecological costs and limiting factors on computation, from Mél Hogan’s work on big data and natural resource extraction to media reports on cryptocurrency’s unsustainable energy consumption.41 In Richardson’s time, the limiting factor on computation wasn’t coal, but the human body. As Mar Hicks reminds us, before it was a device, the “computer” was an occupation.42 Through finite differences and grid techniques, Richardson sought to address the material constraints of computation. The grid is then not only a model for weather prediction’s conceptual organization, but also a management plan for its actual execution. Just as they do for modern-day cubicle farms, grids facilitate particular arrangements of labor.
The labor that Richardson maps out would have been staggering. By extrapolating his own time working on Weather Prediction, he predicts that 64,000 computers – people doing computations by hand – might sufficiently calculate the weather at the pace of it happening.43 The grid’s capacity to parse the equations into discrete parts is central to producing and managing a Fordist division of labor that Richardson assumes is necessary for meteorology as an enterprise. To organize this immense work in a physical building, he proposes the “forecast-factory,” one of his most-quoted and enduring concepts. The “factory” would be an immense spherical room with a grid of the planet projected on its interior. Individual computers would sit on balconies corresponding to territories on the grid-map and receive data transmissions from their corresponding meteorological stations out in the field. They would then continue to work on the calculations from these transmissions and send them to a central command in the middle of the room, who would then assemble forecasts and transmit them back to the outside world.44 Seb Franklin notes that in this factory model, Richardson has imagined a prototype of what we would now recognize as cloud computing, with distributed calculations reconstituted in a main “center.”45 Moreover, this is a model of computation that extends smoothly across the globe through the formal equivalence of the grid; indeed, it reconstitutes a virtual globe in its physical architecture. This workflow, which moves from outside observation to interior calculation back to outside prediction, is fundamental to contemporary computational weather prediction, which relies on virtualized models of planetary phenomena. The difference is that contemporary virtual models are entirely numerical, not a simulated architectural mock-up. Instead of human beings, the computers are silicon semiconductors; instead of a building, the “factory” is a supercomputer. What remains of Richardson’s dream is its organizational schema – the grid as the computational partition of the planet.
Addressing the Planet
Weather maps operate at the contact point between real geographic space and virtual computer models. In doing so, they facilitate mediatic connections between these categories. In the case of Richardson’s equations, these connections were theoretical and mathematical. In his maps, as in the Ophelia map, these connections are visual and aesthetic. The grid in the Ophelia map orients our attention to space, as we recognize the familiar techniques of latitude and longitude. A rainbow emanates from the Bay of Biscay and extends northeast to cover Ireland and the British Isles. At first glance, we might think these colors correspond to the movement of the hurricane itself, but the key reveals that these are instead measures of probabilities that various places will experience hurricane-force winds over the next five days. We’re not looking at a hurricane, but rather a set of possible hurricanes across divergent futures. The arc curves, almost gracefully, until terminating abruptly at the glitched boundary. The grid is a formal irruption: the imposition of the right angle where there was otherwise a curve, the substitution of the finite for the continuous.
No weather events are finite, though. Their interconnectedness is precisely what makes them so difficult to model and predict. Yet by its very nature this weather map participates in visual regimes of isolation. We see Europe in a Mercator projection; Ophelia travels alone, visually unconnected to any other atmospheric phenomena undoubtedly occurring at the same time. The computer modeled these phenomena, just as it modeled the wind-speed probabilities at the grid’s cut-off point. Weather maps, after all, are only slices of global models, purpose-built to serve immediate needs. By representing a small subset of Ophelia’s meteorological effects, this map and its grid logic contributes to a sense of a hurricane as a single isolated disaster. As Grossman notes, weather visualizations participate in aesthetic regimes that do not always “pronounce [themselves] as such.”46 Our cartographic poetics have naturalized the grid logics of latitude and longitude. This aestheticization, in turn, “obscures the human scale of weather crises,” as Grossman writes, setting limits on our understanding of their full nature and scope.47
In Ireland alone, Ophelia reached wind speeds of 156 km/h. It lifted roofs off houses, downed power lines, and lead to three deaths.48 But confining one’s view to just the storm’s immediate effects misses some of its stranger behaviors. In London, Twitter users photographed a sky turned deep red as the storm approached, the result of North African dust kicked up and scattered into the atmosphere.49 En route from Africa, these same winds incited raging wildfires in Portugal and Spain, which had experienced an incredibly hot and dry summer in the months leading up to Ophelia’s landfall. These effects fall off the grid, even as they are some of our strongest examples of the expanding scope of extreme weather crises.
At first glance, the Ophelia glitch seems inconsequential, easily fixed by adjusting some variables. After all, NOAA’s predictions were essentially correct. Ophelia did follow the tracks and intensities displayed in the map. Yet this moment of instability points to broader anxieties around the weather and climate, particularly as storms grow in power and transgress their preconceived boundaries. Given that forecasts are powerful tools for bringing the weather down to human scale, public confidence in them is integral not only to proper crisis management, but also serves an epistemological function. If we can’t believe these predictions, then how will we believe the realities of global warming? Without the imagined correspondence between real phenomena and virtual prediction, the prediction itself has no power to predict, the model no power to model. If we see the models for what they really are—constructed computer simulations—does that run the risk of undermining public faith in those correspondences? Wendy Hui Kyong Chun argues that climate models present a paradox for knowledge production.50 We produce them precisely so that their predictions might never come to pass; climate models urge action that makes their ultimate predictions unverifiable. If we believe that a climate model predicts ecological collapse, then ideally we militate against that collapse, thereby disproving the model. The Ophelia map, albeit on a smaller scale, betrays a similar conceptual tension. It must close the gap between real and virtual space through its media techniques.
Grids close this gap through the address, the linkage of thing and location. Recall Siegert’s observation that grids facilitate data storage and retrieval. Through the imposition of a grid, a space becomes storage.51 Addresses name points on the grid and attach those locations to objects of some kind. They are literal building addresses, latitude-longitude pairs, URLs, phone numbers, or any string that turns a location of some kind into a fungible marker. Within computational networks, an object’s addressability is crucial to its visibility and participation in a social field. As Benjamin Bratton argues, “if something that has an address is addressable, it is present, and stripping something of its address, or turning off its address, erases it from that world (italics in original).”52 Florian Sprenger puts it more bluntly: “only addressable units exist,” modifying Kittler’s famous dictum.53 By attaching addresses to physical objects, one makes them legible within virtual networks. Similarly, as virtual networks proliferate through physical infrastructures, the ability to address an object has tangible consequences. Addressing then becomes a crucial operation by which grids institute political relations across real and virtual space.
On the Ophelia map’s geospatial grid, the relationship between two objects’ addresses takes after their real-world relationship. Distance on a map, for instance, corresponds in some ratio to distance on the planet, accounting for map projections. However, as Bratton and Sprenger note, computational addressing does not necessarily need to correspond to the physical world. These networks produce grids whose addresses can associate with each other in ways topologically distinct from real-world space. “Globally our regular networks of bundled addressors and addresses wear grooves into information channels,” Bratton writes, “sometimes aligning with geopolitical borders and interests and sometimes perforating them.”54 For Sprenger, this disarticulation emerges from the proliferation of mobile computing devices, which can associate with each other irrespective of geographical place.55 A crude but effective example might be the area code of a cell phone, which ostensibly corresponds to a device’s geographic region, but which now is more often than not meaningless except as a marker of where a person may have once lived. Consequently, we can see how grids are not simply representations of real-world phenomena, but rather constitute worlds of relation in and of themselves. Take, for instance, the multiple “parallel universes” of hurricanes proposed by the Ophelia map and its underlying modeling technologies. These probabilities correspond to different computational models, each hypothesizing the existence of possible futures.56 While these simulations are nominally distinct, the grid collapses their individual virtual worlds into shared probability fields, construing relationships otherwise impossible in physical space. When taken together, their information density actually exceeds that of the planet itself. Put another way: we can know the models at higher resolutions than we could ever blanket the planet with sensors. In a very real sense, we know more about these virtual earths than we do our actual planet.57
At first glance, addressing a hurricane in a digital network seems a far different task than addressing a mobile phone. Yet as Jennifer Gabrys argues, the advent of remote ecological sensing technologies in the second half of the twentieth century has made the project of understanding environments “analogous to computational processes.”58 “Read through devices such as sensors and satellites,” she writes, “ecology is now a shifting entity that typically becomes visible—and manageable—as information.”59 From the standpoint of computation, assembling a “hurricane” as a discrete entity entails taking measurements from across an area and then compositing them into a digital object. But where does a hurricane begin and end? What kinds of information should get included in the modeling process? Ultimately, grids both define areas of measurement and provide conceptual infrastructures for determining what kinds of phenomena can become data at all.
As with any infrastructure, these systems of data collection, management, and analysis chug along smoothly and invisibly until one day they don’t. In this case, if only in a small way, that day was October 15th, 2017. Extreme weather events test digital infrastructures just as much as they test physical ones. Ophelia fractured an otherwise tidy virtual system, exposing the wires underneath. By disrupting our habitual correspondence between atmosphere and simulation, the Ophelia glitch reveals weather forecasts as media that train a viewing public into a particular understanding of weather. The grid reflects and reinforces cultural assumptions about the nature of hurricanes. On the grid, weather phenomena are cyclical, bounded, and legible within pre-existing geopolitical systems. (How often do we see maps that abruptly stop at national borders, as if the wind obeys border control?) Even as forecasts are prime vectors for raising public awareness about the damaging effects of extreme weather events, they are still media technologies that depend on the subordination of the planet to regimes of data. Only some experiences fit on the grid. All else falls off.
Postscript
Infrastructures work until they don’t. As of this writing, the United States’ government has exited a thirty-five-day partial shutdown caused by President Trump’s insistence that the government construct a physical wall along the US-Mexico border. During the shutdown, most of the federal government’s operations slowed to a crawl, supported, if at all, by skeleton crews of unpaid workers. While technically a critical department kept open during lapses in appropriations, the National Weather Service (NWS) struggled to make forecasts. Its employees worked unpaid on twenty-four-hour shift work. Originally, the NWS planned a February 2019 launch of a new version of its Global Forecast Model, the United States’ main computational weather model. That launch has been delayed indefinitely. While the NWS continues to use its old model, its quality is quickly falling behind as it struggles to take in global data from more up-to-date systems abroad. After all, Richardson’s grid has long since saturated the globe. Forecasting is a planetary enterprise. Without smoothly functioning geopolitical operations and alliances, forecasting cannot happen at all. These systems are more sensitive than we realize: NWS scientists noted during the shutdown that the United States’ forecast models will be off-kilter for years to come as a result of these lapsed months.60 In the immediate future, hurricane preparedness for 2019 depends on data collected earlier in the year; as such, we may find that surprising storms such as Ophelia evade our prediction this time around.
We’re right back with Richardson’s 64,000 computers toiling away in the forecast-factory. Despite the highly computational nature of contemporary forecasting, it is far from an automated enterprise. It relies on massive expenditures of human labor, countless “maintainers,” to borrow a word from Andrew Russel and Lee Vinsel, who keep the lights on and update fragile systems.61 Without their work, these systems fall into disrepair. Grid techniques can preserve the illusion of discipline and conceptual order, but only for a little while. Moments of geopolitical and climatological crisis test their mediatic power. It may turn out in the end that the force of a hurricane is stronger than any conceptual management the grid affords. The weather will become more unmanageable, unruly, and untamed.
For popular media stories on the Ophelia glitch, with Brennan’s quotes in many, see Eleanor Cummins, “Tropical Storm Ophelia Really Did Break the Weather Forecast Grid,” Slate, October 16, 2017; Rachel Becker, “Storm Ophelia Was so Unusual, It Was Literally Off the Charts,” The Verge, October 17, 2017; and Caroline Haskins, “Even Meteorologists Think Hurricane Ophelia Is Really Weird,” Motherboard, October 16, 2017. ↩
Thanks to Grant Wythoff for his indefatigable wrangling of the editorial process; to Kellie Robertson and Matthew Kirschenbaum for feedback on earlier versions; to Setsuko Yokoyama and Skye Landgraf for conversations that enriched and refined this iteration; and to the two anonymous peer reviewers for their notes and encouragement. ↩
National Hurricane Center, “Here are the latest Key Messages for #Ophelia…” Twitter, October 15, 2017. ↩
Shannon Mattern, “Mapping’s Intelligent Agents,” Places, September 26, 2017, https://placesjournal.org/article/mappings-intelligent-agents/. ↩
Bernhard Siegert, Cultural Techniques: Grids, Filters, Doors, and Other Articulations of the Real, trans. Geoffrey Winthrop-Young (New York: Fordham University Press, 2015), 97. ↩
John Durham Peters, “Infrastructuralism: Media as Traffic Between Nature and Culture,” in Traffic, ed. Marion Näser-Lather and Christof Neubert (Leiden: Brill, 2015), 32, https://doi.org/10.1163/9789004298774_003. ↩
Nicole Starosielski, The Undersea Network (Durham: Duke University Press, 2015), 3. ↩
Jussi Parikka, A Geology of Media (Minneapolis: University of Minnesota Press, 2015), 12. ↩
Christian Ulrik Andersen and Søren Bro Pold, The Metainterface: The Art of Platforms, Cities, and Clouds (Cambridge, MA: The MIT Press, 2018), 153–54. ↩
Judd A. Case, “Logistical Media: Fragments from Radar’s Prehistory,” Canadian Journal of Communication 38, no. 3 (September 14, 2013): 380, https://doi.org/10.22230/cjc.2013v38n3a2735. ↩
Janine Randerson, Weather as Medium (Cambridge, MA: MIT Press, 2018), 44. ↩
Sara J. Grossman, “Ugly Data in the Age of Weather Satellites,” American Literature 88, no. 4 (December 2016): 817–18, https://doi.org/10.1215/00029831-3711138. ↩
Paul N. Edwards, A Vast Machine: Computer Models, Climate Data, and the Politics of Global Warming (Cambridge, MA: The MIT Press, 2010), 83–85. ↩
For a fuller exploration, I recommend Geoffrey Winthrop-Young, Ilinca Iurascu, and Jussi Parikka’s co-edited special edition of Theory, Culture, and Society 30, no. 6 (November 2013) on cultural techniques, which serves as an excellent primer to the field’s major figures. ↩
Geoffrey Winthrop-Young, “Cultural Techniques: Preliminary Remarks,” Theory, Culture & Society 30, no. 6 (November 2013): 2–3, https://doi.org/10.1177/0263276413500828. ↩
Here I am indebted to Liam Cole Young’s excellent intellectual history of cultural techniques in his List Cultures: Knowledge and Poetics from Mesopotamia to Buzzfeed (Amsterdam: Amsterdam University Press, 2017), pp. 39–43. ↩
Friedrich A. Kittler, Discourse Networks 1800/1900 (Stanford: Stanford University Press, 1992). ↩
Siegert, Cultural Techniques, 9. ↩
Cornelia Vismann, “Cultural Techniques and Sovereignty,” Theory, Culture & Society 30, no. 6 (November 2013): 84, https://doi.org/10.1177/0263276413496851. ↩
Young, List Cultures, 42. ↩
Donna Haraway, “The Companion Species Manifesto,” in Manifestly Haraway (Minneapolis: University of Minnesota Press, 2016), 95. ↩
Siegert, Cultural Techniques, 98. ↩
Abelardo Gil Fournier, “Seeding and Seeing: The Inner Colonisation of Land and Vision,” APRJA 6, no. 1 (2017), http://www.aprja.net/seeding-and-seeing-the-inner-colonisation-of-land-and-vision/. ↩
Siegert, Cultural Techniques, 98. ↩
Siegert, Cultural Techniques, 102–11. ↩
Rob Nixon, Slow Violence and the Environmentalism of the Poor (Cambridge, MA: Harvard University Press, 2011), 47–48. ↩
Lewis Fry Richardson, Weather Prediction by Numerical Process (Cambridge, UK: University of Cambridge Press, 1922), vii,https://archive.org/details/weatherpredictio00richrich. ↩
Richardson, Weather Prediction by Numerical Process, vii. ↩
In particular, Peter Lynch’s The Emergence of Numerical Weather Prediction: Richardson’s Dream (Cambridge, UK: Cambridge University Press, 2006) is a book-length reworking of Richardson’s equations. Lynch demonstrates how Richardson failed to account for the sheer amount of noise in his dataset, and how contemporary techniques of data smoothing and adjustment result in accurate forecasts. ↩
Kristine Harper, Weather by the Numbers: The Genesis of Modern Meteorology, Transformations (Cambridge, MA: MIT Press, 2008), 14. ↩
For more on the textual materiality of early weather data, see Sarah Grossman, “Archiving Weather Data,” Process: A Blog for American History, May 4, 2017, http://www.processhistory.org/archiving-weather-data/. ↩
Harper, Weather by the Numbers, 17. ↩
Caren Kaplan, Aerial Aftermaths: Wartime from Above (Durham: Duke University Press, 2018), 52–53. ↩
Edwards, A Vast Machine, 85–87. ↩
Edwards, A Vast Machine, 88. ↩
Richardson, Weather Prediction by Numerical Process, viii. ↩
Richardson, Weather Prediction by Numerical Process, 219. ↩
Richardson, Weather Prediction by Numerical Process, frontispiece. ↩
Richardson, Weather Prediction by Numerical Process, 184. ↩
Richardson, Weather Prediction by Numerical Process, 185. ↩
Mél Hogan, “Big Data Ecologies,” Ephemera 18, no. 3 (2018): 631–57; Timothy B. Lee, “New Study Quantifies Bitcoin’s Ludicrous Energy Consumption,” Ars Technica, May 17, 2018, https://arstechnica.com/tech-policy/2018/05/new-study-quantifies-bitcoins-ludicrous-energy-consumption/. ↩
Mar Hicks, Programmed Inequality: How Britain Discarded Women Technologists and Lost Its Edge in Computing (Cambridge, MA: MIT Press, 2017), 157. ↩
Richardson, Weather Prediction by Numerical Process, 219. ↩
Richardson, Weather Prediction by Numerical Process, 219–20. ↩
Seb Franklin, “Cloud Control, or the Network as Medium,” Cultural Politics 8, no. 3 (January 1, 2012): 452–53, https://doi.org/10.1215/17432197-1722154. ↩
<Grossman, “Ugly Data in the Age of Weather Satellites,” 828. ↩
Grossman, “Ugly Data in the Age of Weather Satellites,” 828. ↩
For more details on the storm’s effects, see Paul Moore, “An Analysis of Storm Ophelia Which Struck Ireland on the 16th October 2017” (Glasnevin Hill, Dublin 9: Met Éireann, 2018), a post-mortem analysis from the Irish Meteorological service. Reports in popular media include Danny Boyle and Chris Graham, “Ophelia: Ireland Recovers from Worst Storm on Record That Killed Three,” The Telegraph, October 16, 2017; and Angela Chen, “Storm Ophelia Hits Ireland, Prompting First Ever Severe Weather Alert for the Entire Country,” The Verge, October 16, 2017. ↩
Elaina Zachos, “3 Weird Impacts from Storm Ophelia Explained,” National Geographic News, October 16, 2017, https://news.nationalgeographic.com/2017/10/hurricane-ophelia-tropical-storm-ireland-red-skies-fires-science-spd/. ↩
Wendy Hui Kyong Chun, “On Hypo-Real Models or Global Climate Change: A Challenge for the Humanities,” Critical Inquiry 41, no. 3 (March 2015): 678, https://doi.org/10.1086/680090. ↩
Although beyond the conceptual scope of this paper, readers invested in Heidegger might think here with his concept of Gestell, or enframing, through which the planet becomes a Bestand, or “standing-reserve”—a set of resources available for use. Siegert obliquely discusses these resonances himself, and Young fleshes them out in more detail in pp. 103–06 of List Cultures. ↩
Benjamin H. Bratton, The Stack: On Software and Sovereignty (Cambridge, MA: MIT Press, 2015), 205. ↩
Florian Sprenger, “Modes of Address and Ontologies of Disconnection: Towards a Media Archaeology of Mobile Networks,” Media Theory 2, no. 1 (2018): 156. ↩
Bratton, The Stack, 206. ↩
Sprenger, “Modes of Address and Ontologies of Disconnection,” 157. ↩
Here I follow another proposal of Chun’s that we think of weather and climate models not as hyperreal, but rather hypo-real, as tools for the production of hypotheses and speculative imaginings of possible futures. See Chun, “On Hypo-Real Models,” 678. ↩
In this I am indebted to a conversation with Andrew Blum, who shared this insight from his research toward his forthcoming book, The Weather Machine: A Journey Inside the Forecast (Ecco, 2019). ↩
Jennifer Gabrys, Program Earth: Environmental Sensing Technology and the Making of a Computational Planet (Minneapolis: University of Minnesota Press, 2016), 15. ↩
Gabrys, Program Earth, 15. ↩
Angela Fritz, “The National Weather Service Is ‘Open,’ but Your Forecast Is Worse Because of the Shutdown,” The Washington Post, January 18, 2019, https://www.washingtonpost.com/weather/2019/01/07/national-weather-service-is-open-your-forecast-is-worse-because-shutdown/. ↩
Andrew Russell and Lee Vinsel, “Hail the Maintainers,”Aeon, 2016, https://aeon.co/essays/innovation-is-overvalued-maintenance-often-matters-more. ↩
Article: Author does not grant a Creative Commons License as part of this Agreement.
Image: "Intereactions," (Screenshots) by Eric Schmaltz with Kevin McPhee and Graeme Ring (2017).