


Let us imagine Frank Pick (1878–1941) as a lucky and slightly overworked person. When he took responsibility for the public relations of London’s subterranean trains in 1908, no one guessed that the young lawyer and statistician was about to change the town’s image forever. The history of urban traffic, architecture, design and art would not be the same without Pick. It was he who commissioned the spatial redesign of subway stations to include clear signs and more space for the public bills of railway companies. The seminal introduction of a unified script font – the Johnston Underground Railways Sans – owes much to his initiative. The common usage of the red-white roundel with a blue crosspiece added to this early achievement in corporate design. Pick emphasized the role of the public poster, thereby popularizing graphic avant-garde art in England. Cubism, Futurism, Vorticism and the Bauhaus became part of the public domain on the walls of London’s underground. His desire to shape each and every aspect of the underground look was occasionally regarded as somewhat dictatorial. Nonetheless, Pick integrated architecture itself into the design of London Transport: Charles Holden’s elegant and functional 1920s buildings became part of a meticulous overall concept that promoted its own modernity and efficiency.1 Frank Pick’s career reached its pinnacle when he was appointed as managing director in 1928, followed by a position as chairman of the London Passenger Transport Board, established in 1933.
We should not imagine Henry Charles Beck (1902–1974) as an unhappy person, although his life in the 1920s was characterized by unsecure part-time jobs. Starting in 1925, Beck worked as a draftsman at the Signal Engineer’s Office of the London railroads. His freelance jobs were often for commercial artwork, ranging from illustrations for the corporate magazine to public advertisements. His sketch for the now famous Tube Map was created in 1931, during a period of unemployment, on a spread in his personal notebook (fig. 1).
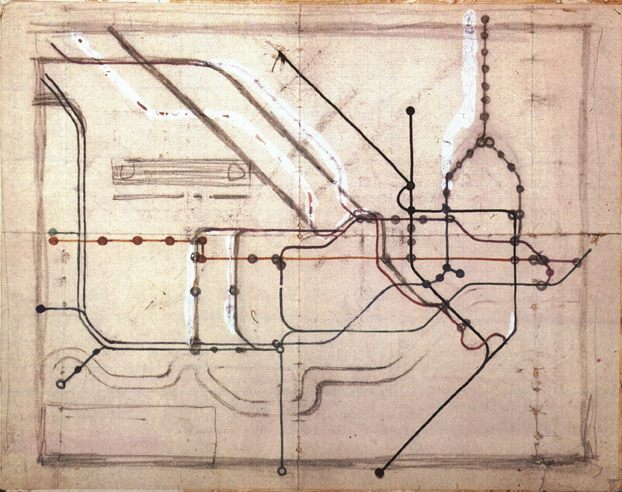
Fig. 1: Henry Charles Beck, first Tube Map sketch on checkered paper, 1931. Pencil and ink in a notebook, 7.5 x 9.5 in. Victoria and Albert Museum London, no. E.814-1979.2
Beck submitted his design to the Publicity Department, headed by Frank Pick. While his enthusiastic colleagues had encouraged Beck to do so, it was regarded as being “too revolutionary” and discarded by the public relations office.3 One year later he revised the first draft and received a less reluctant response. Pick remained skeptical towards the new network map. Finally, he ordered a risky first print run of 750,000 copies in January 1933. One month later, another 100,000 copies were printed.
Harry Beck received pay of about nine dollars for this original piece of work, which had been sketched during a time of unemployment. Though his job situation became more steady in the 1930s, Beck never attained the same level of recognition as the London Transport employees. In return for signing over his copyright, the draftsman insisted that all future network changes be done by him personally.4 He became embittered when London Transport repeatedly disregarded this agreement, and until his work was rediscovered in the 1990s Beck remained virtually unknown. Despite these difficulties, his role needs to be emphasized, for the Tube Map design has proven to be a genuine solution to passenger navigation, even though institutional struggles almost prevented Beck’s work from being used. For London, as we shall see, it came at exactly the right time.
But how shall we imagine underground railroad travel in London around 1930? What kind of changes did Pick’s and Beck’s innovations bring with them? The following approach tackles the fluidity and ephemerality of urban transport, while exploring its material media culture and the 1920s as the “age of traffic.”5 Its protagonists are not primarily a manager and a draftsman, although they both play significant roles. More importantly, I shall present elements of a material network archaeology: daily passengers, emerging masses, urban events, tickets, metro plans, stations’ architecture, time recorders for trains, overwritten timetables, delay diagrams, signal boxes, governmental infrastructure policy and film fragments. While materiality is not a key point in social network analysis (SNA) and the thriving formal science of complex networks, it is foundational for the archaeology of networking practices. So the humanities are obliged to emphasize the materiality of networks while taking their mediations into account. The question to be posed alongside actor-network theory (ANT) and the German research on cultural techniques (Kulturtechniken) is: Which hybrid material and semiotic elements mobilize and stabilize an urban network that is used for movement? In drawing on the historical networking practices needed for this, I am going to place emphasis on the uniqueness and situated character of networks – as opposed to generalizing universal theories like social network analysis and complex networks science. Therefore, I will analyze the tacit operations of the London Transport railroad writing systems, their localized use in the formation of network time, and the specific relationship between perception and circulation. Following Beck’s map not only shows how urban perception became accustomed to nodes and connections; the Tube Map also played an integral role in twentieth-century network history, which in itself shifted more and more to practical timing issues, and to logistical temporization in general. To handle the ever-fluctuating traffic, techniques of synchronization became more and more important.
1. Henry Charles Beck Draws the Metropolis
If you’re going underground, why do you need to bother about geography? It’s not so important. Connections are the thing.
— Henry Charles Beck6
Picture the London of 1891. The German engineer Ludwig Troske wrote about the very first and very steamy subway, which had been in use ever since 1863: “Traffic on the suburban lines is not very comfortable for the foreign traveler at first. A certain exercise and routine is necessary to orientate easily and quickly. Once one is out of bright daylight, approaching the station, the eye attempts to adapt to the new surroundings. … The varying trains possess certain distinctive features on their front sides. Alas, in all that dim station light, along with the comparatively fast approaches, such signs only help the expert.” Not only boarding the train but also disembarking requires concentration, “because the mandatory call of the station’s name often remains incomprehensible. The name of the station is otherwise only written in small lettering and attached to several lantern posts…” Signposts on the wall appear lost within the swarm of advertisements.7
Now picture the London of 1933. London Transport, a conglomerate of six railroad lines organized in five companies, published a new kind of map. The “Tube” had been electrified starting in 1890, with most reconstructions done by 1910. On the reverse side of the new map, there was a list of station names and a very polite invitation reflecting the typical style of public relations created by Frank Pick: “A new design for an old map. We welcome your comments.”
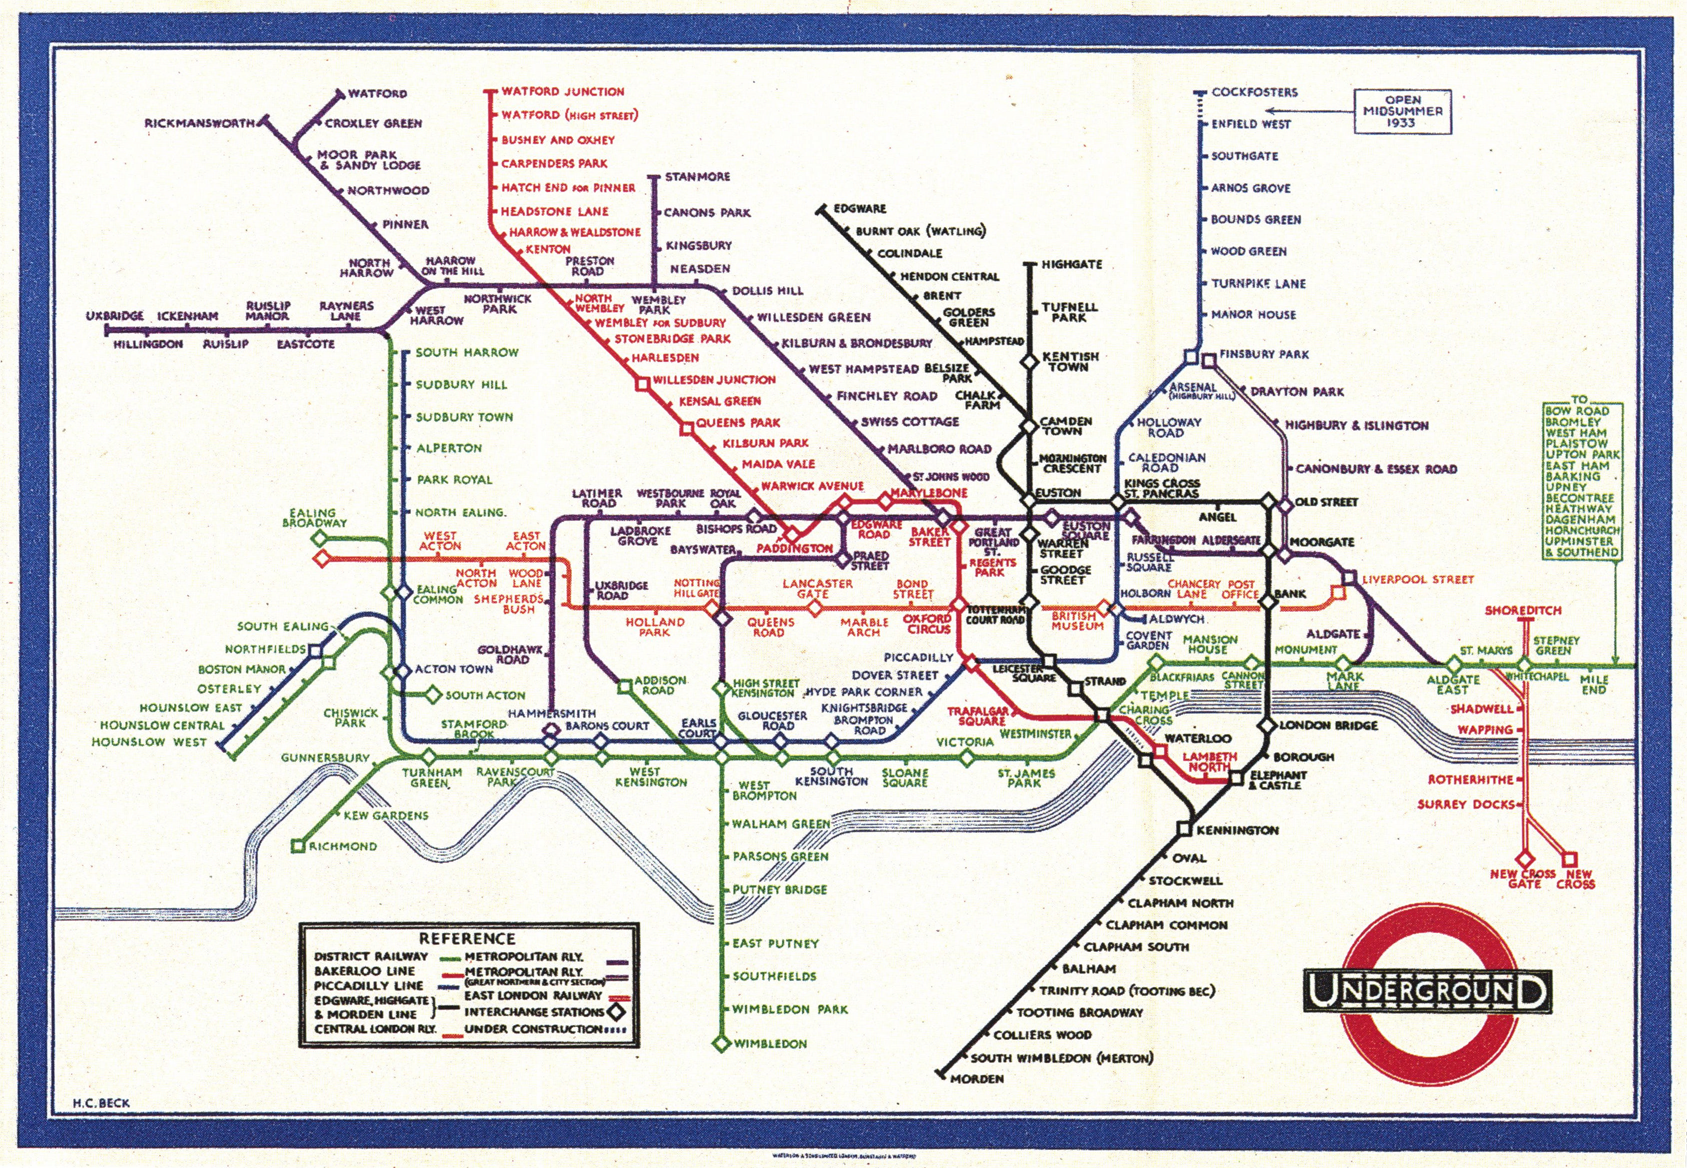
Fig. 2: Henry Charles Beck, Tube Map, January 1933. Color lithograph, first edition, 9.0 x 6.3 in. Printed at Waterlow & Sons Ltd., London, Dunstable, Watford.8
The requested comments of London’s subway audience disappeared as part of oral history. Nonetheless, the somewhat magical transformation of a topographical map (fig. 3) in a topological diagram has provoked a multitude of scholarly comments.
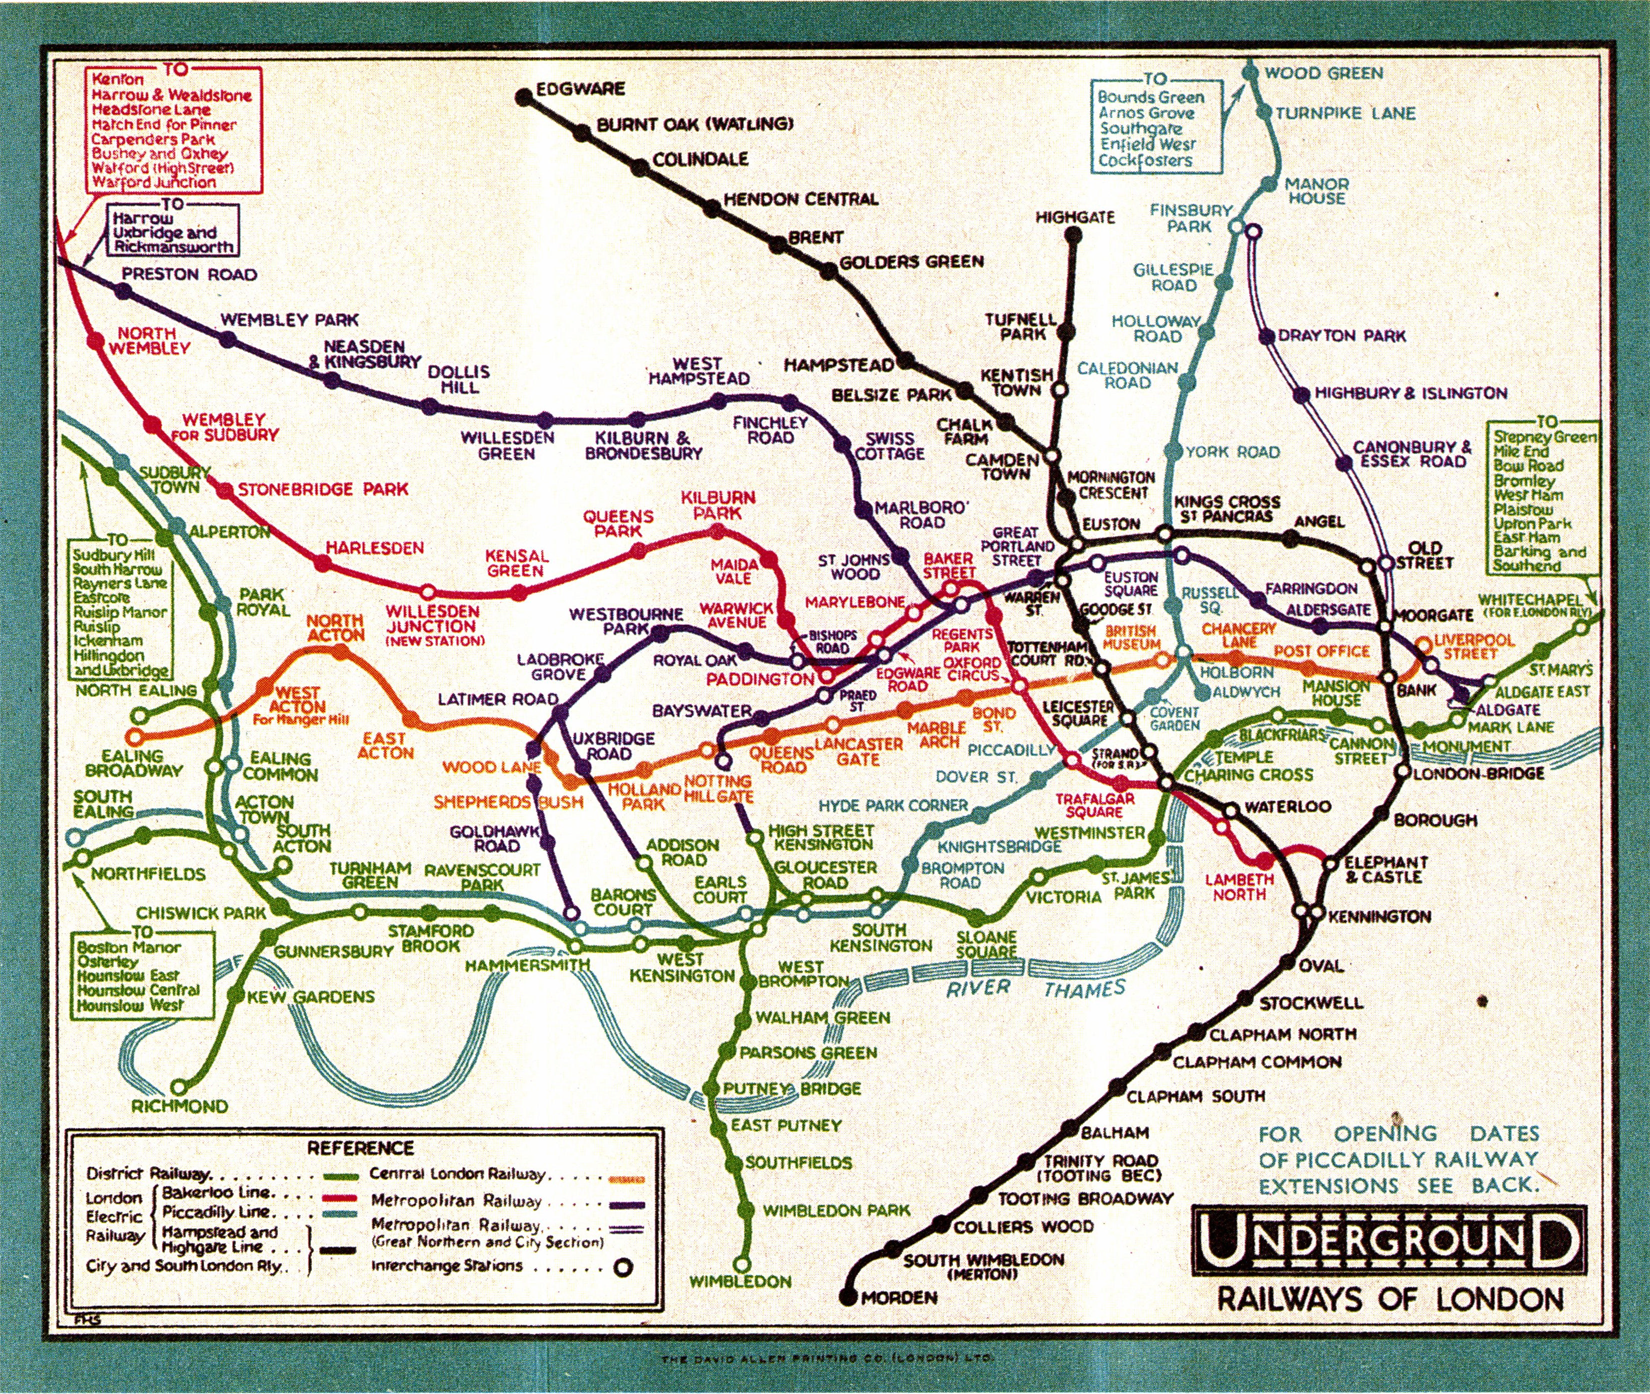
Fig. 3: Frederick H. Stingemore, Underground Railways of London, 1932. Color lithograph, 5.5 x 6.5 in. Printed by David Allen Printing Co., London.9
In the context of art and design history, the altered Tube Map has been understood to be a part of Constructivism and of everyday mythology as per Roland Barthes.10 Current research prefers to focus on the map as an “immutable mobile” with reference to Bruno Latour.11 Most approaches leave out the material network archaeology of subterranean traveling and the organization of public transport in the 1920s and 1930s. My take on the subject is going to emphasize these phenomena.
Henry Charles Beck’s seminal design has also been reappreciated through recent scholarship that describes its aesthetics as a modernist electromechanical imagination of ordered space-time.12 London Transport willingly ignored Beck’s influence, but within the last 25 years historians have rehabilitated the designer and made him very popular.13
If we trace the steps of this late triumph, the perspective might change a bit from the map’s geometric overview to historical contingencies and contradictions. It is well known that Beck’s coworkers compared the specific aesthetics of his drawing to circuit diagrams. Beck himself whimsically made fun of that attribution when a caricature was published in the company’s Train, Omnibus and Tram Staff Magazine in March 1933 (fig. 4).
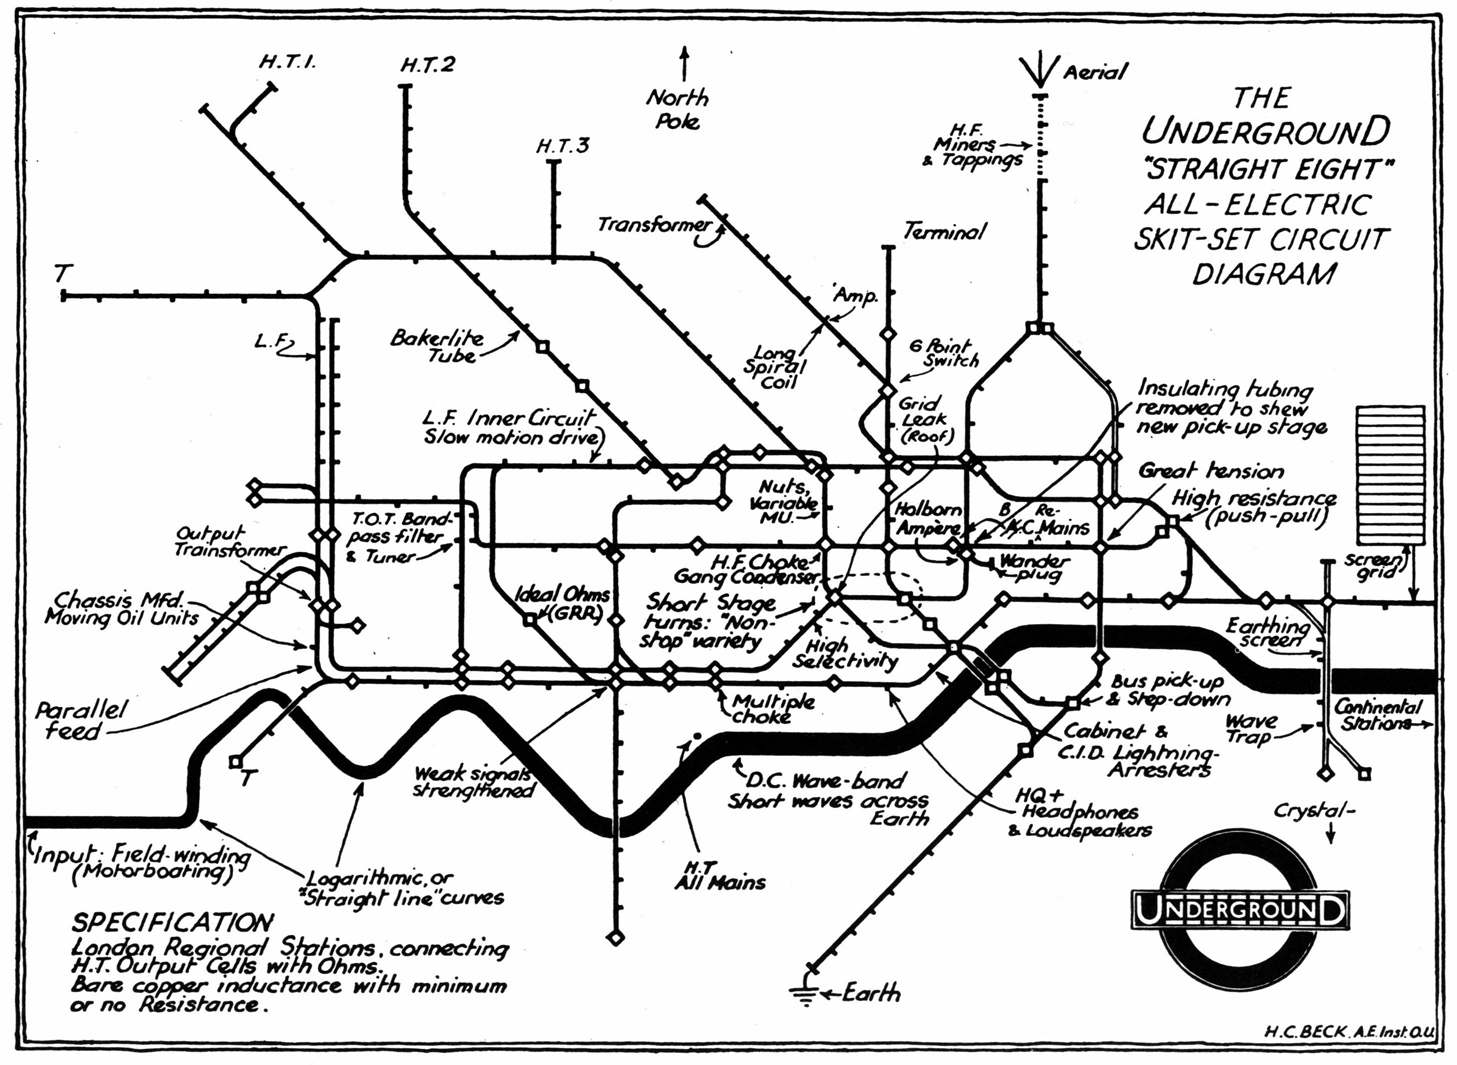
Fig. 4: Henry Charles Beck, Underground “Straight Eight” All-Electric Skit-Set Circuit Diagram, March 1933. Drawing in Train, Omnibus, and Tram Staff Magazine.14
In this sketch, the river Thames figures as a logarithmical curve: there is high tension at the Bank of England; the British Museum serves as a “wonder plug”; an antenna becomes the top part of the Piccadilly line. Therefore, the circuit has to be earthed in the southern portion. This adds to the famous circuit diagram hypothesis, which we even might extend. Could it be that the Tube Map uses a semeiological form that refers to the tacit practices of train management, its railway control centers and signal boxes, therefore including very specific techniques of synchronization?
Even the last surface landmark of the Tube Map proves Beck’s intention to abandon the topographical scale. The highly abstract Thames River is drawn using angles of 45 degrees. The consistent use of these angles creates the hitherto unknown systemic regularity of the rail network. On another note, the Tube Map fulfills a mathematical criterion for networks: neither angles nor the length of lines must mimic real geographical relations. Beck added an important graphic detail when he decided to picture stations without a transfer point through small “ticks” as opposed to the diamonds and circles of interchanges. He also integrated an already known technique that drew the periphery closer to the center.15 The distances in Central London appear greater than they actually are, while the distance between suburban stations in so-called “metroland” is reduced for the purpose of the diagram. This approximation of the suburbs follows a social transformation of urban space: at the end of the nineteenth century the railroad system had begun to allow the poorer class a life in the surrounding areas of London.16
In the end, the Tube Map proves to be an index for a relational and topological turn on a wider scale,17 which is pushed a bit further by the emergence of the diagram itself. In the case of London, topography transforms into a highly specific form of topology. The diagram rationalizes the fluid relationality of traffic flows in a geometric manner. For this, the paper grid underlying the first sketch plays a significant role. Upon closer look, Beck’s omission of geography is not complete. The correction fluid on the first sketch shows the manner in which geometric topology and geographical references interact (fig. 1). Yet geographical measures count less within this framework, and relational Constructivism overcomes a rather mimetic approach.
The Tube Map imports the aesthetics of Eastern and Middle European avant-gardes, including Constructivism and the Bauhaus. Frank Pick’s public relations strategy also proved to be extremely attractive to artists like Man Ray and László Moholy-Nagy. Both delivered highly spectacular poster works for London Transport in the 1930s.18 In this context, Moholy-Nagy designed a world network map for the Imperial Airways airline that transferred Beck’s topological aesthetics to the connections of world air traffic while juxtaposing a diagram and a map view (fig. 5).

Fig. 5: László Moholy-Nagy, Imperial Airways Map of Empire & European Air Routes, April 1936. Color lithograph, 39.1 x 25 in. British Airways Archive and Museum Collection, Hounslow.19
The rediscovery of Beck’s importance – which can even be found in statements like “We’d be lost without Harry Beck” – is imbued with new emphasis.20 Many comments insist repeatedly that the Tube Map is based on an evolution from map to diagram. This seems overly simplified if we remember Nelson Goodman’s statement that all maps, being geometric figures, are diagrams, yet not all diagrams depict maps.21 Quite often “the DIAGRAM” has been written in capital letters to describe the Tube Map. All of this does not yet reveal how the material practices of railroad operation around 1930 relied heavily on diagrammatic schemes. In the context of network archaeology, the question is raised as to how spatial and temporal forms of traffic flows are constituted by diagrams which are situated between drawing, writing, calculating, movement and time. The production of simultaneity and the synchronization of traffic events prove to be a key condition for the success of rail networks: the switching of passengers at interchanges. The abstract aesthetics of the Tube Map should also be understood as temporal – picturing a perfectly timed network. This goes along with a repeatedly projected, yet impossible synchronization of the network on timekeeping and on socioeconomic levels.
Henry C. Beck’s map should be understood in the context of the following phenomena:
1. The merger of the five independent, market-listed, constantly quarreling railroad companies running the six London lines. Starting in July 1933, these actors were united in the London Passenger Transport Board (LPTB). The chaos of independent lines and different prices was recognizable in the multitude of different tickets that existed before 1933.22 The longing for a “penny transport” to meet the same ends as Rowland Hill’s unification of post tariffs in the 1840s is a vivid part of the cultural history of London’s railroads.23
2. The continual updating of an iconic design that started with the introduction of the discus-like, bull’s-eye trademark in 1908,24 followed by Edward Johnston’s corporate font Underground Railway Sans in 191825 – including Frank Pick’s constant push for an unique corporate identity.
3. The movements of passengers in the station’s architectures, especially the switching between different lines, which kept Henry Charles Beck occupied until the end of his life.26
4. The ambitious attempt of spatiotemporal synchronization in the entire London network, which was already quite advanced on the level of timekeeping and operations management.
2. London Transport: Synchronization along the Line
[L]a forme d’une ville / Change plus vite, hélas, que le cœur d’un mortel …
— Charles Baudelaire, Tableaux Parisiens27
Scenario 1: Paper – Hand – Telephone
Handling urban railroad traffic significantly differs from that of overland trains. Nineteenth-century England saw the rise of a specific intermedial constellation, including optical semaphores, Charles Wheatstone’s five-needle telegraph, and steam trains. Overland traffic called for the introduction of a standard time that was based on the timetable.28 In an urban environment, however, managing a high train frequency is much more important. The impulse for more electromechanical control might have started with the overland lines. In the accelerated tact of metropolitan space, a networked control was to become ever more important.
For instance, the contingent positions of moving trains could be traced in three different scenarios of synchronization, which required paper records or blinking light bulbs on an illuminated diagram. For the alliance of telegraph and railroads, the telephone started to assume importance, although the operating companies were skeptical to use phones in the beginning.
The contemporary trade journal Railway Gazette regularly portrayed the manifold interconnected apparatuses, ranging from signal boxes to automated telephone switching, including the control rooms of land lines. A photographic example from the year 1932 offers a general view of how the practices of recording train movement worked. It shows the control room of the London & North Eastern Railway at Darlington, between Durham and York (fig. 6).
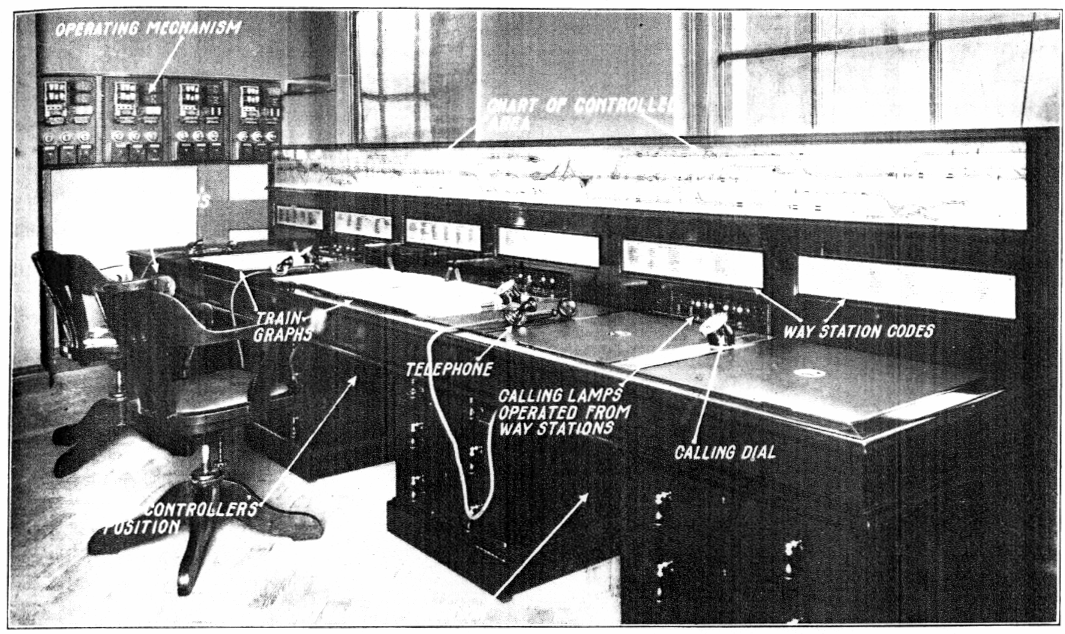
Fig. 6: Control Room of the London & North Eastern Railway with the graphic recording of train runs (left), Darlington, 1932.29
On a blotting pad – simply called a graph – train traffic was noted down via a hand-drawn pencil line. Utilizing a piece of paper with a vertical division into hours and minutes, every message from the train line was noted “in relation to time and place” so that a continuous line emerged.30
Seen within this context, the topological form of Beck’s map was tied to the everyday office work of directing and recording railroad traffic. Both writing systems were based on an adjusted Cartesian coordinate system. Though typographic and aesthetic viewpoints add to the form of the Tube Map, it also relied heavily on the everyday norms of railroad writing systems.
Scenario 2: Pneumatics – Levers – Electrical Impulse
The actual complexity of the networked control of urban trains can be seen in a ten-minute training film from 1921, whose second part is slightly fragmentary. Signalling on the Ealing and Shepherd’s Bush Railway reenacts, through its rhythm of intertitles and documentary material, a splendid absence of any disturbances in mechanical and electromechanical control.31 It presents the linear measures needed for manual shunting, including filmic disruptions in the second part of the film, which in its surviving form includes abrupt cuts and an announcement for material; the material is never shown. The use of the train as a self-writing system was quite remarkable. Crossing a lever along the line caused electrical signaling. With the train’s passage the signal lever was reset, and the momentary position of a train within a section flashed in an illuminated diagram (fig. 7).
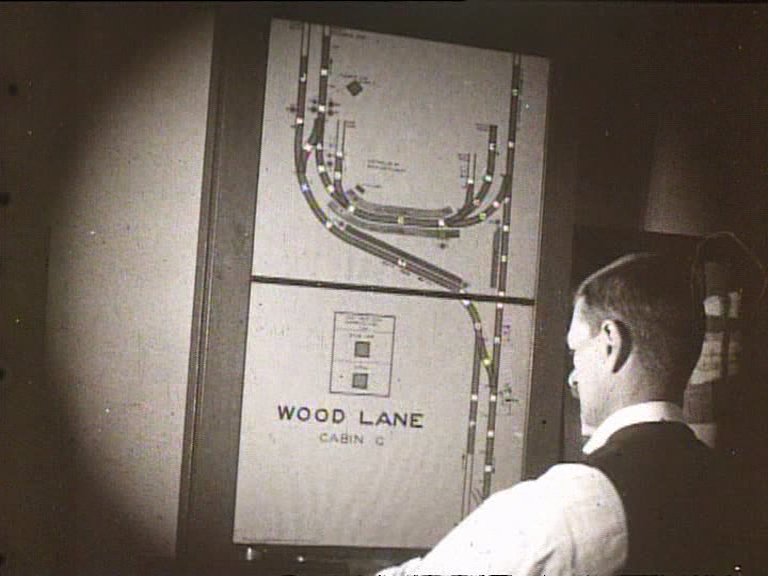
Fig. 7: Illuminated diagram for train localization. Digital film still from Signalling on the Ealing and Shepherd’s Bush Railway, 1921 [2007].32
Technically, the British train equipment, which was predominately made by Westinghouse, oscillated between two-state and three-state differences. The most common forms were either “clear” and “danger” or “on” and “off.” Optical semaphores – with exactly three angles of 0, 45 and 90 degrees – hint at the operations evoked by the Tube Map’s geometry. In the London underground tunnels, optical semaphores were not really useful; flashlights with two colors were used instead. The code “go/stop” has proven to be the most helpful in surroundings where trains run with the same speed and a similar kind of acceleration and deceleration. Historically, the flashlight’s code probably resulted from the binary difference of the weather-warning fog repeaters that replaced the older acoustic warnings of a responsible fog man.37 The difference between “go” and “stop” was also related to a material reason: foggy or non-foggy weather.
Scenario 3: Paper – Clocks – Network Timing
What happens once an underground train is delayed? How to deal with the masses of passengers that are so typical on a London soccer Sunday? Measuring, control and corrections generated delay diagrams, overwritten timetables and filled-out signal report failure forms. A revised timetable from the contemporary handbook Handling London’s Underground Traffic of 1928 shows how asynchronicity and resynchronization were being handled (fig. 8).
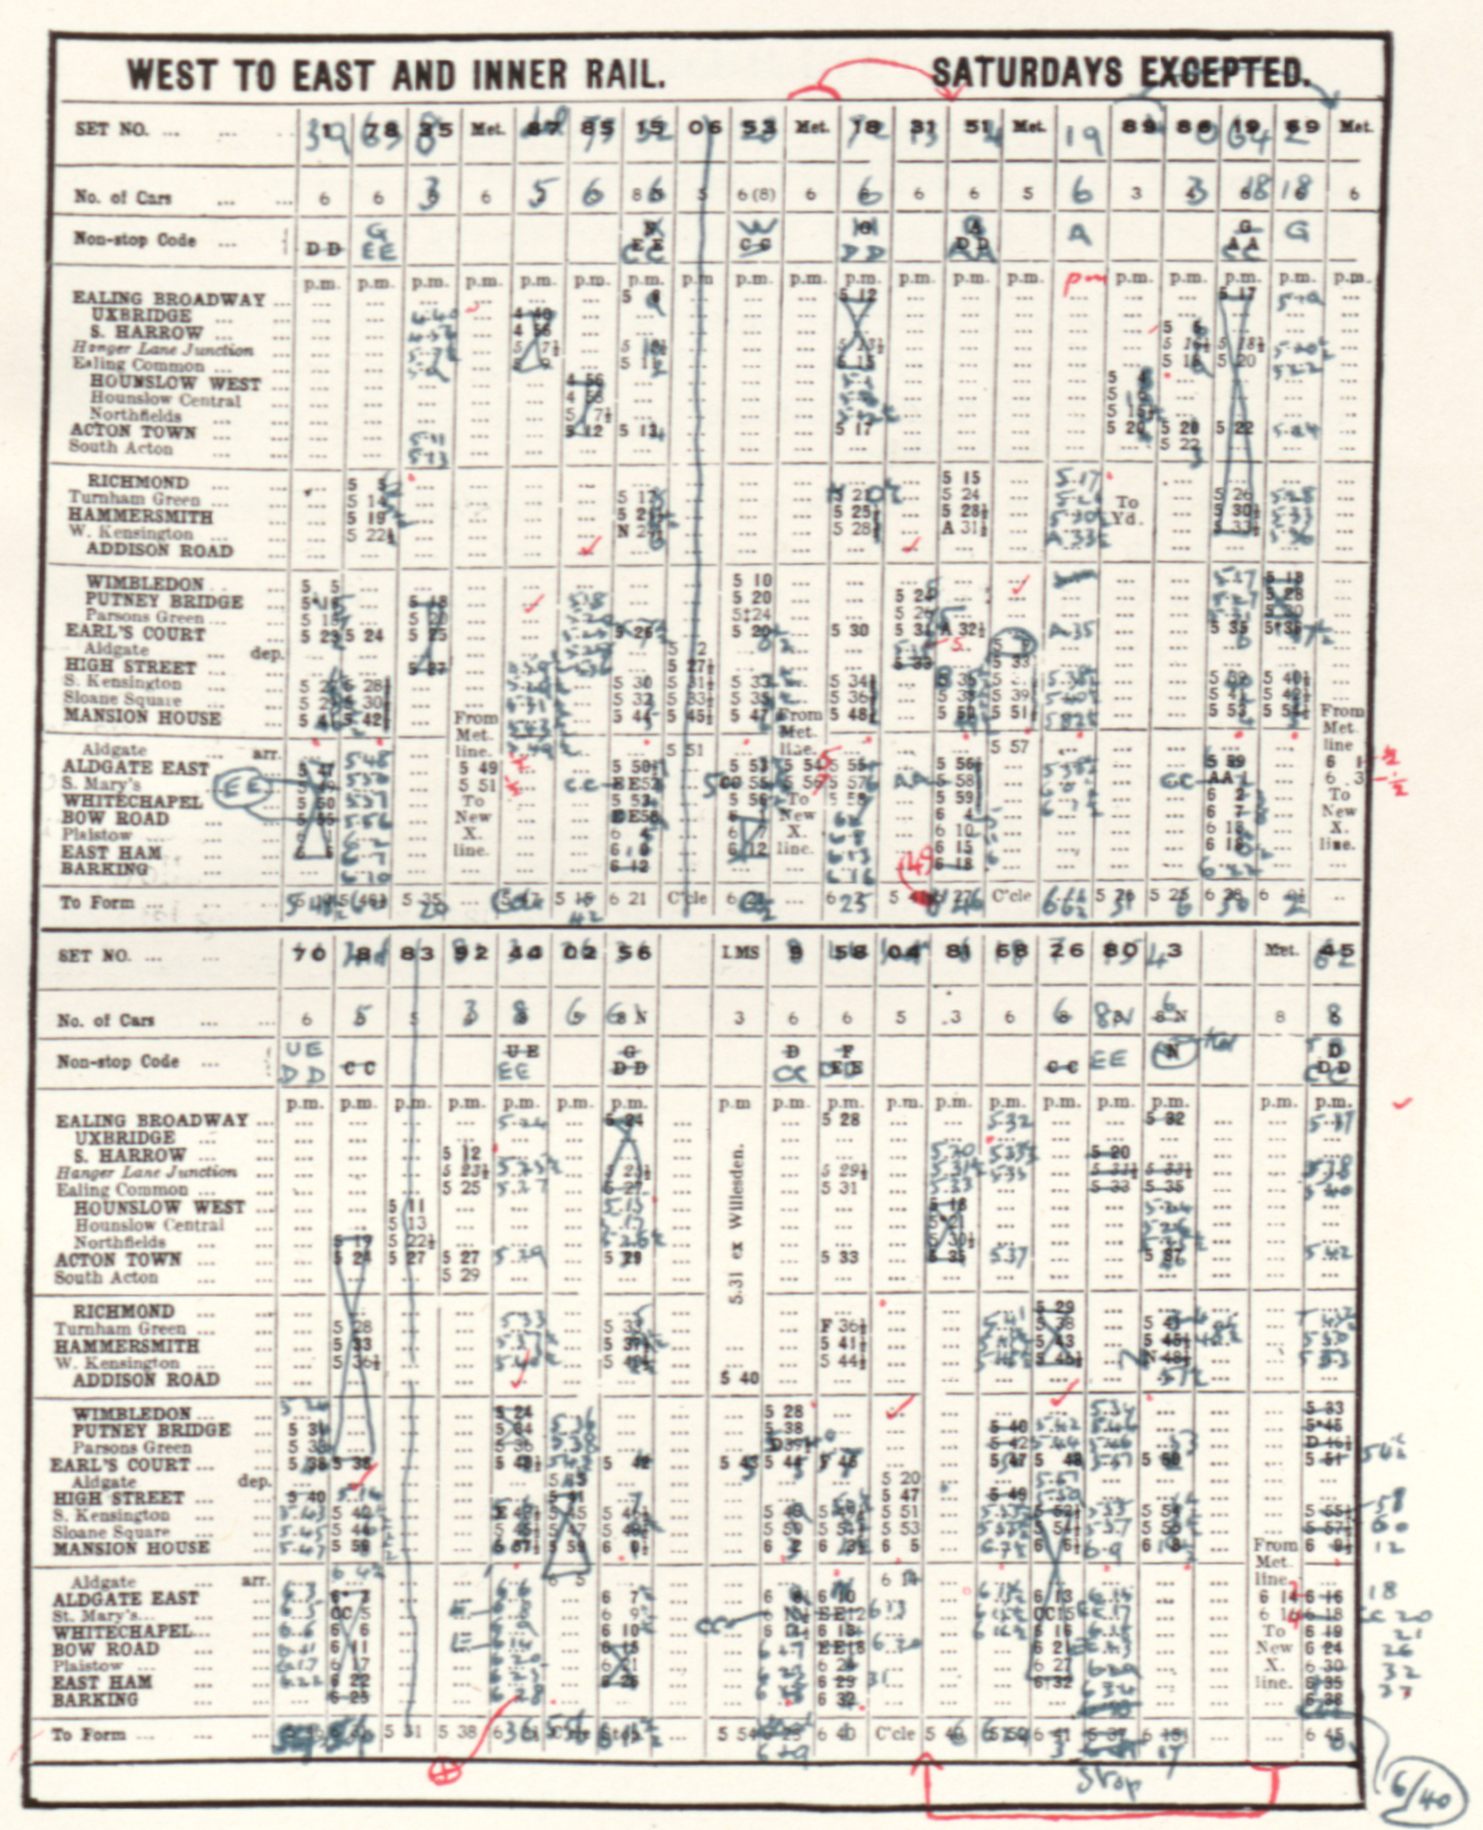
Fig. 8: Revised timetable after interval changes on the District Line, ca. 1928.38
The only four-color reproduction found in the book represents a tiny change in the train management of the District Railway. This is not entirely accidental – the District Railway, pictured in green, is used by soccer fans to get to the stadiums of West Ham and Chelsea. In this case, the early morning times demonstrated how the complex practices of coordination interact: trains that would not have stopped needed to halt at stations that they did not regularly serve. On another note, a London underground line quite often is not really linear, because it integrates several starting points. District Line trains start in Ealing Broadway as well as in Richmond and Wimbledon. This way, trains had to be coordinated behind Gunnersbury and West Kensington, with a high potential for getting stuck. Without this everyday tacit knowledge, including the economic competition between the single lines, the timetable remains largely illegible. John Pattinson Thomas, Operating Manager and author of Handling London’s Underground Traffic, described the situation:
Throughout the various routes covered by the trains of the District Railway there are ten branches. A train may be delayed at Wimbledon, for instance, owing either to unsuitable fog-signalling arrangements or overcrowding, and by the time it reaches Earl’s Court it has missed its path and has to be sandwiched in at the wrong place. This may mean that it fouls the working of a Circle train at South Kensington, causing trains to block back on the bottle neck on a tight 1 1/2-minute headway. Signal to signal checking then occurs, and from an initial 2-minute delay on the branch line an accumulated delay of 10 or 12 minutes may be set up.39
Nonetheless, the railroader’s honor obliged him to limit those potential harms: “Delays, however, are happily of rare occurrence…”40
Apart from the timetable, the interval on the line had to be clocked and recorded. The maximum capacity of a line without loop was 48 trains per hour, which were reset at the end point within 75 seconds. With signaling rigs that were ideally equipped, the minimum distance between trains was 54 seconds, with perfect train stops lasting for only 30 seconds.41 Although the remote control of trains via electrical relays was already possible, the train conductor served as the most important timekeeper. In stations with tight traffic, an automatic headway clock was used (fig. 9).
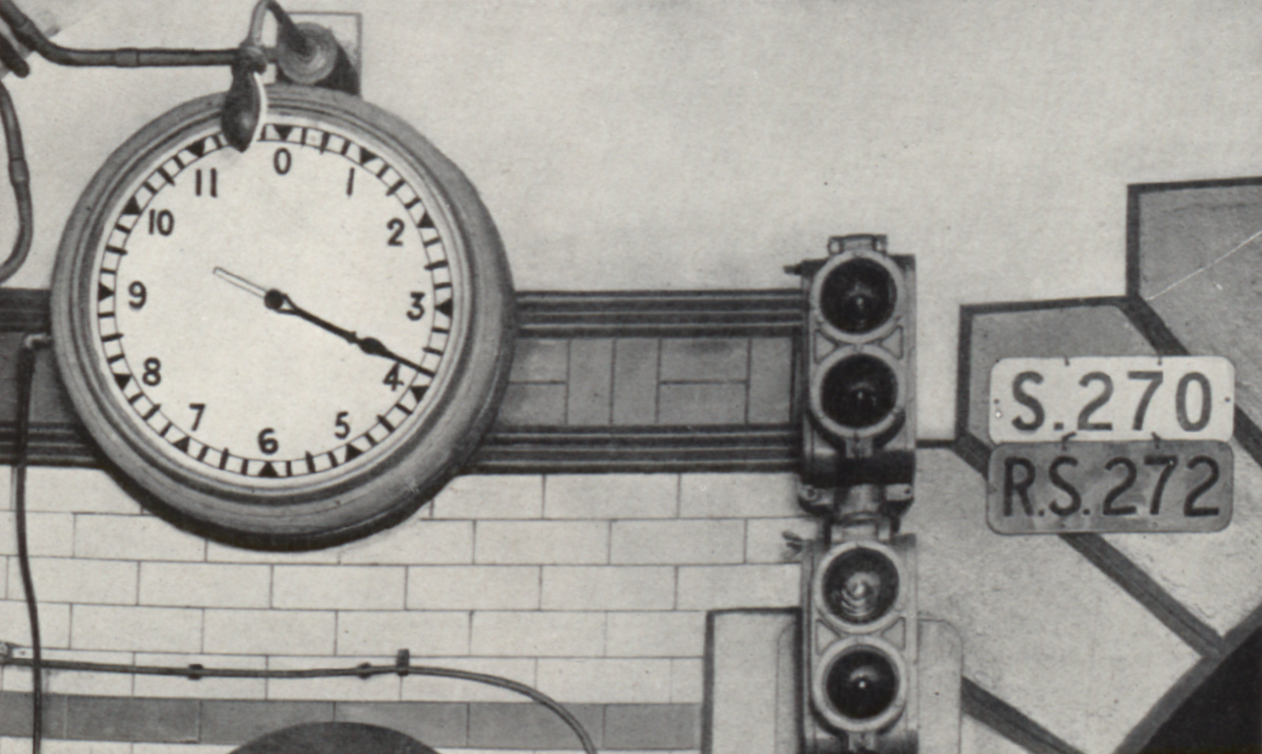
Fig. 9: Headway clock monitoring the distance to the previous train, ca. 1928.42
The headway clock was set to zero once a train leaves the station. The following driver was able to see how far ahead in time the train in front actually is, so he did not “unconsciously” get too close.43 Headway clocks permitted the recording of train frequencies on paper. Along with a headway chart, a very specific underground time was both represented and performed. Every inscription referenced, via an inking ribbon, a bypassed train (fig. 10).
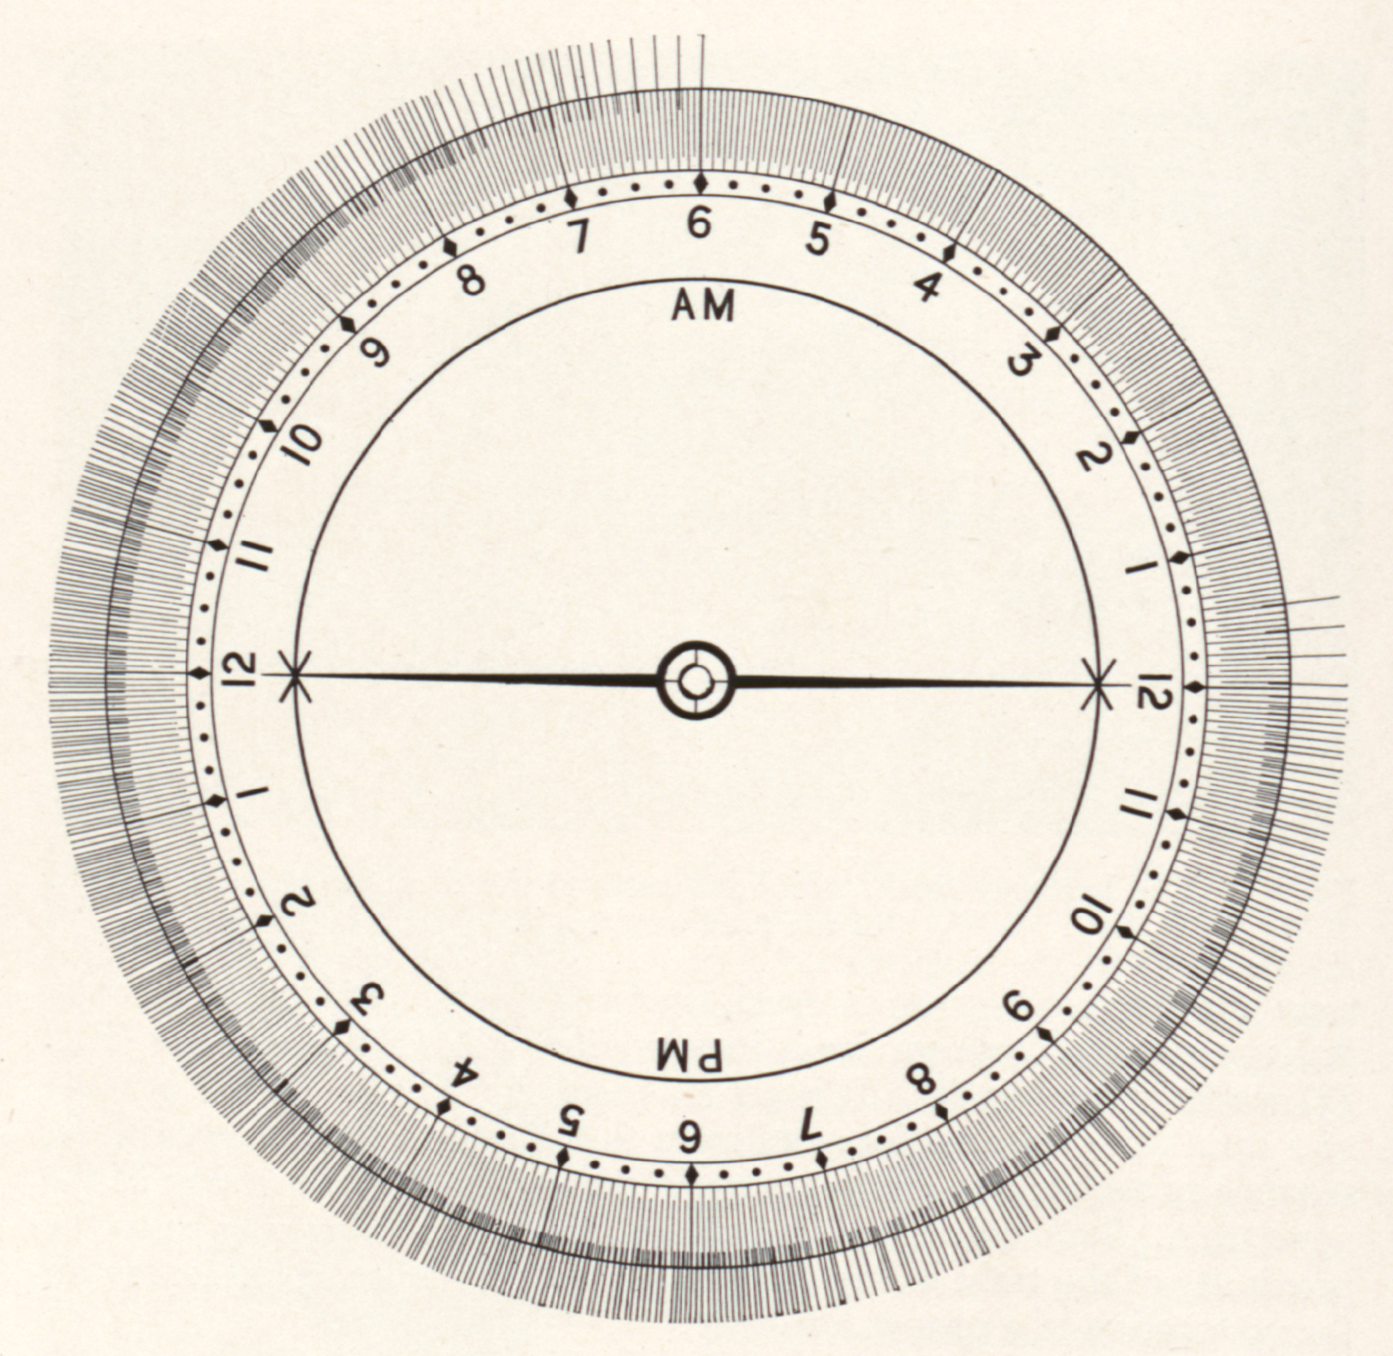
Fig. 10: Headway chart recording the train frequency throughout a day of operation, ca. 1928.44
The quicker the passages, the harder it becomes to differentiate the trains. A railroad day of headway charts had a very material length of nineteen hours. If you draw together the recordings of all six lines, a genuine form of networked time appears. Although it followed the telegraphic synchronization of clocks in the nineteenth century, it also had its very own distinctive features.45
3. London Transport: Synchronizing the Network
The metro is no place for synchrony, in spite of the orderliness of timetables…
— Marc Augé46
All forms of synchronization along the line added to the complexity of the whole network. But they did not allow for overall control. With electromechanical transmission, the data of the Taylorist time punch clocks united to form the framed overall picture that was the Train Recording Diagram (fig. 11).
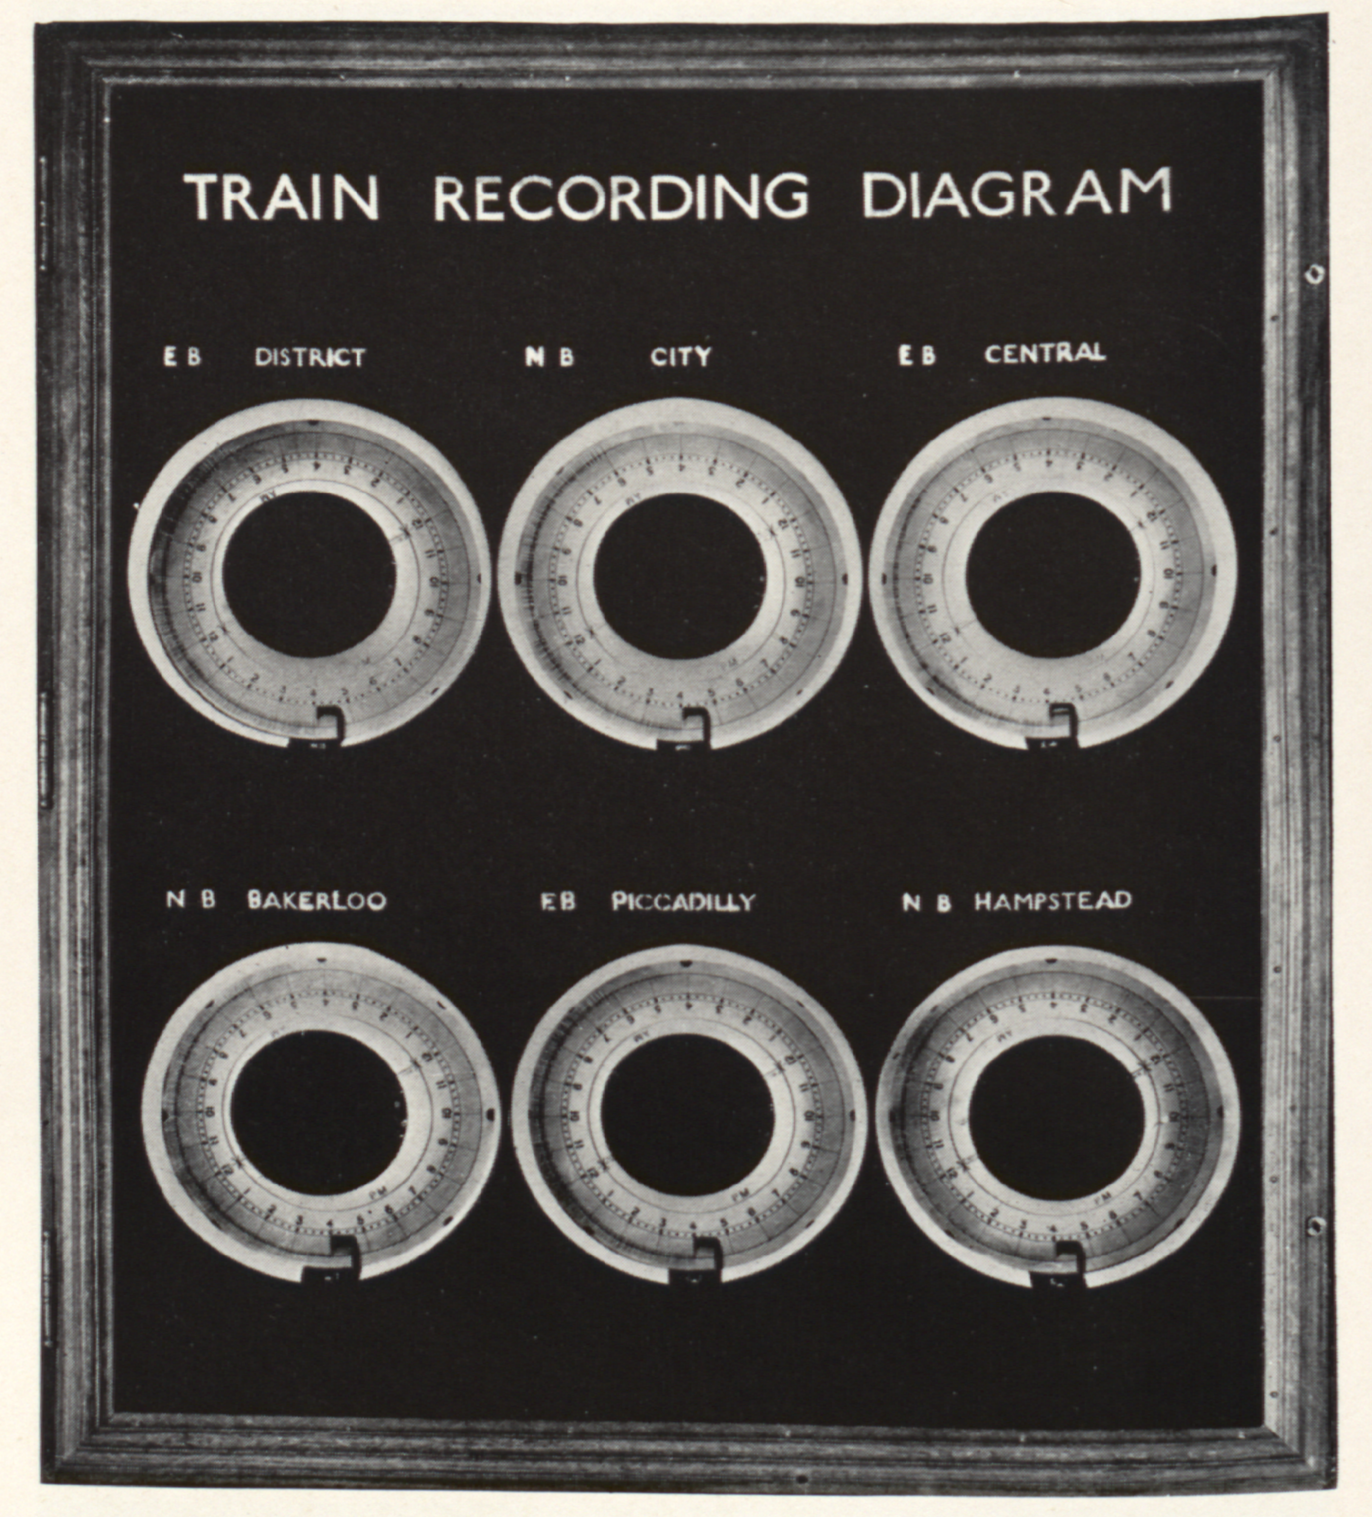
Fig. 11: Automatic Train Recording Diagram for the complete London network, with electrical transmission to headquarters and control rooms, ca. 1928.47
Here, too, the dial rotated with clock speed while the self-inscribing train passages hinted at the simultaneity of network traffic. It might be said that the Train Recording Diagram was a time-measuring and synchronizing equivalent to the topological Tube Map, which it predated.
Its setup in the control office at Leicester Square in 1928 was meant to be a paradigm for equipping the other facilities, “so that the engineering and operating staff will be advised at once, and simultaneously, of the occurrence.”48 Such a will to synchronicity was not only important for the safe conduct of traffic; it also allowed the electricity to be switched off punctually. A synchronous “traction off” was the economic imperative once all trains had come to a halt.
Tactics: Entering, Changing, Disembarking or “Connections Are the Thing”
There is at least one other way to narrate the always sought, yet impossible synchronization within the London underground network. This would be a history of entering, changing and disembarking passengers, including both the visual navigation and the acoustic environment. In London’s everyday tube culture, public announcements have been present for a long time. If you used the escalators of the Hampstead Line in 1921 – which is now the Northern Line – you surely could not have overheard the messages of an apparatus called the “stentorphone” – “Please keep moving: if you must stand, stand on the right: some are in a hurry, don’t impede them.”49 The then contemporary use of gramophones with compressed air amplifier, e.g., at Oxford Circus, consumed about one record a week. Passenger education even made its way into short films dealing with boarding and disembarking. Enjoyable films like The Right and Wrong Way to Board an Electric Train were meant to appeal to audiences and speed up train handling at the same time.50
John Pattinson Thomas’s handbook of 1928 also identified the changing of trains, being a crucial part of network connectivity, as one of the most problematic aspects of tube management:
A different type of connection occurs where the Underground line crosses under or over, but does not physically connect with, another Underground or foreign railway line. This may necessitate (as it does at Charing Cross, the interchange point of District, Hampstead and Bakerloo trains) the synchronization of the times of the first and last trains each day, and this is always carefully carried out.51
Regulating the passenger streams between the lines proved to be a top priority during the remodeling of stations, like the newly designed Piccadilly Circus in 1928 (fig. 12).
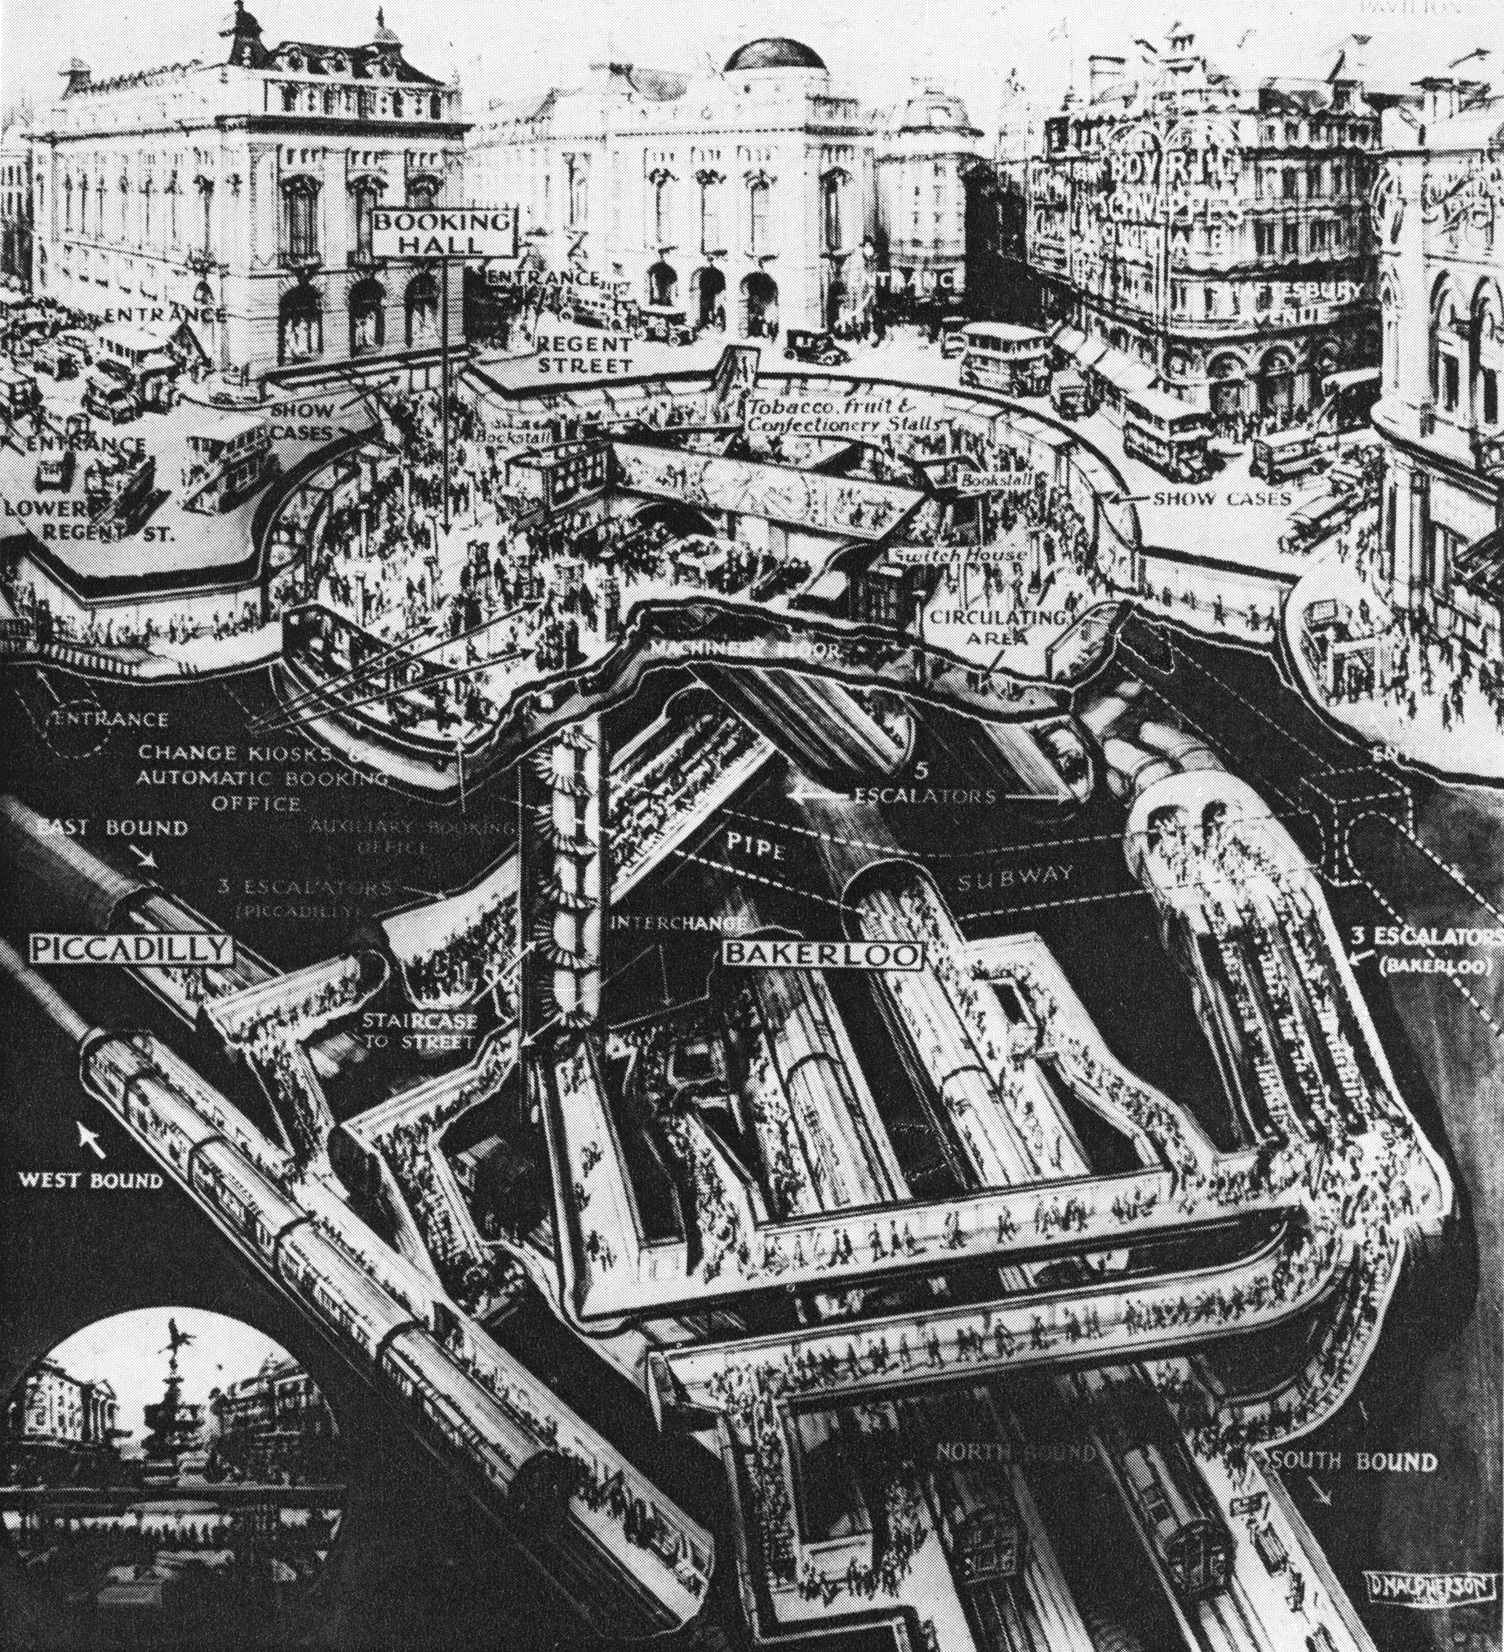
Fig. 12: Unknown artist [D. Macpherson?], Piccadilly Circus station, 1928. Graphic reproduction.52
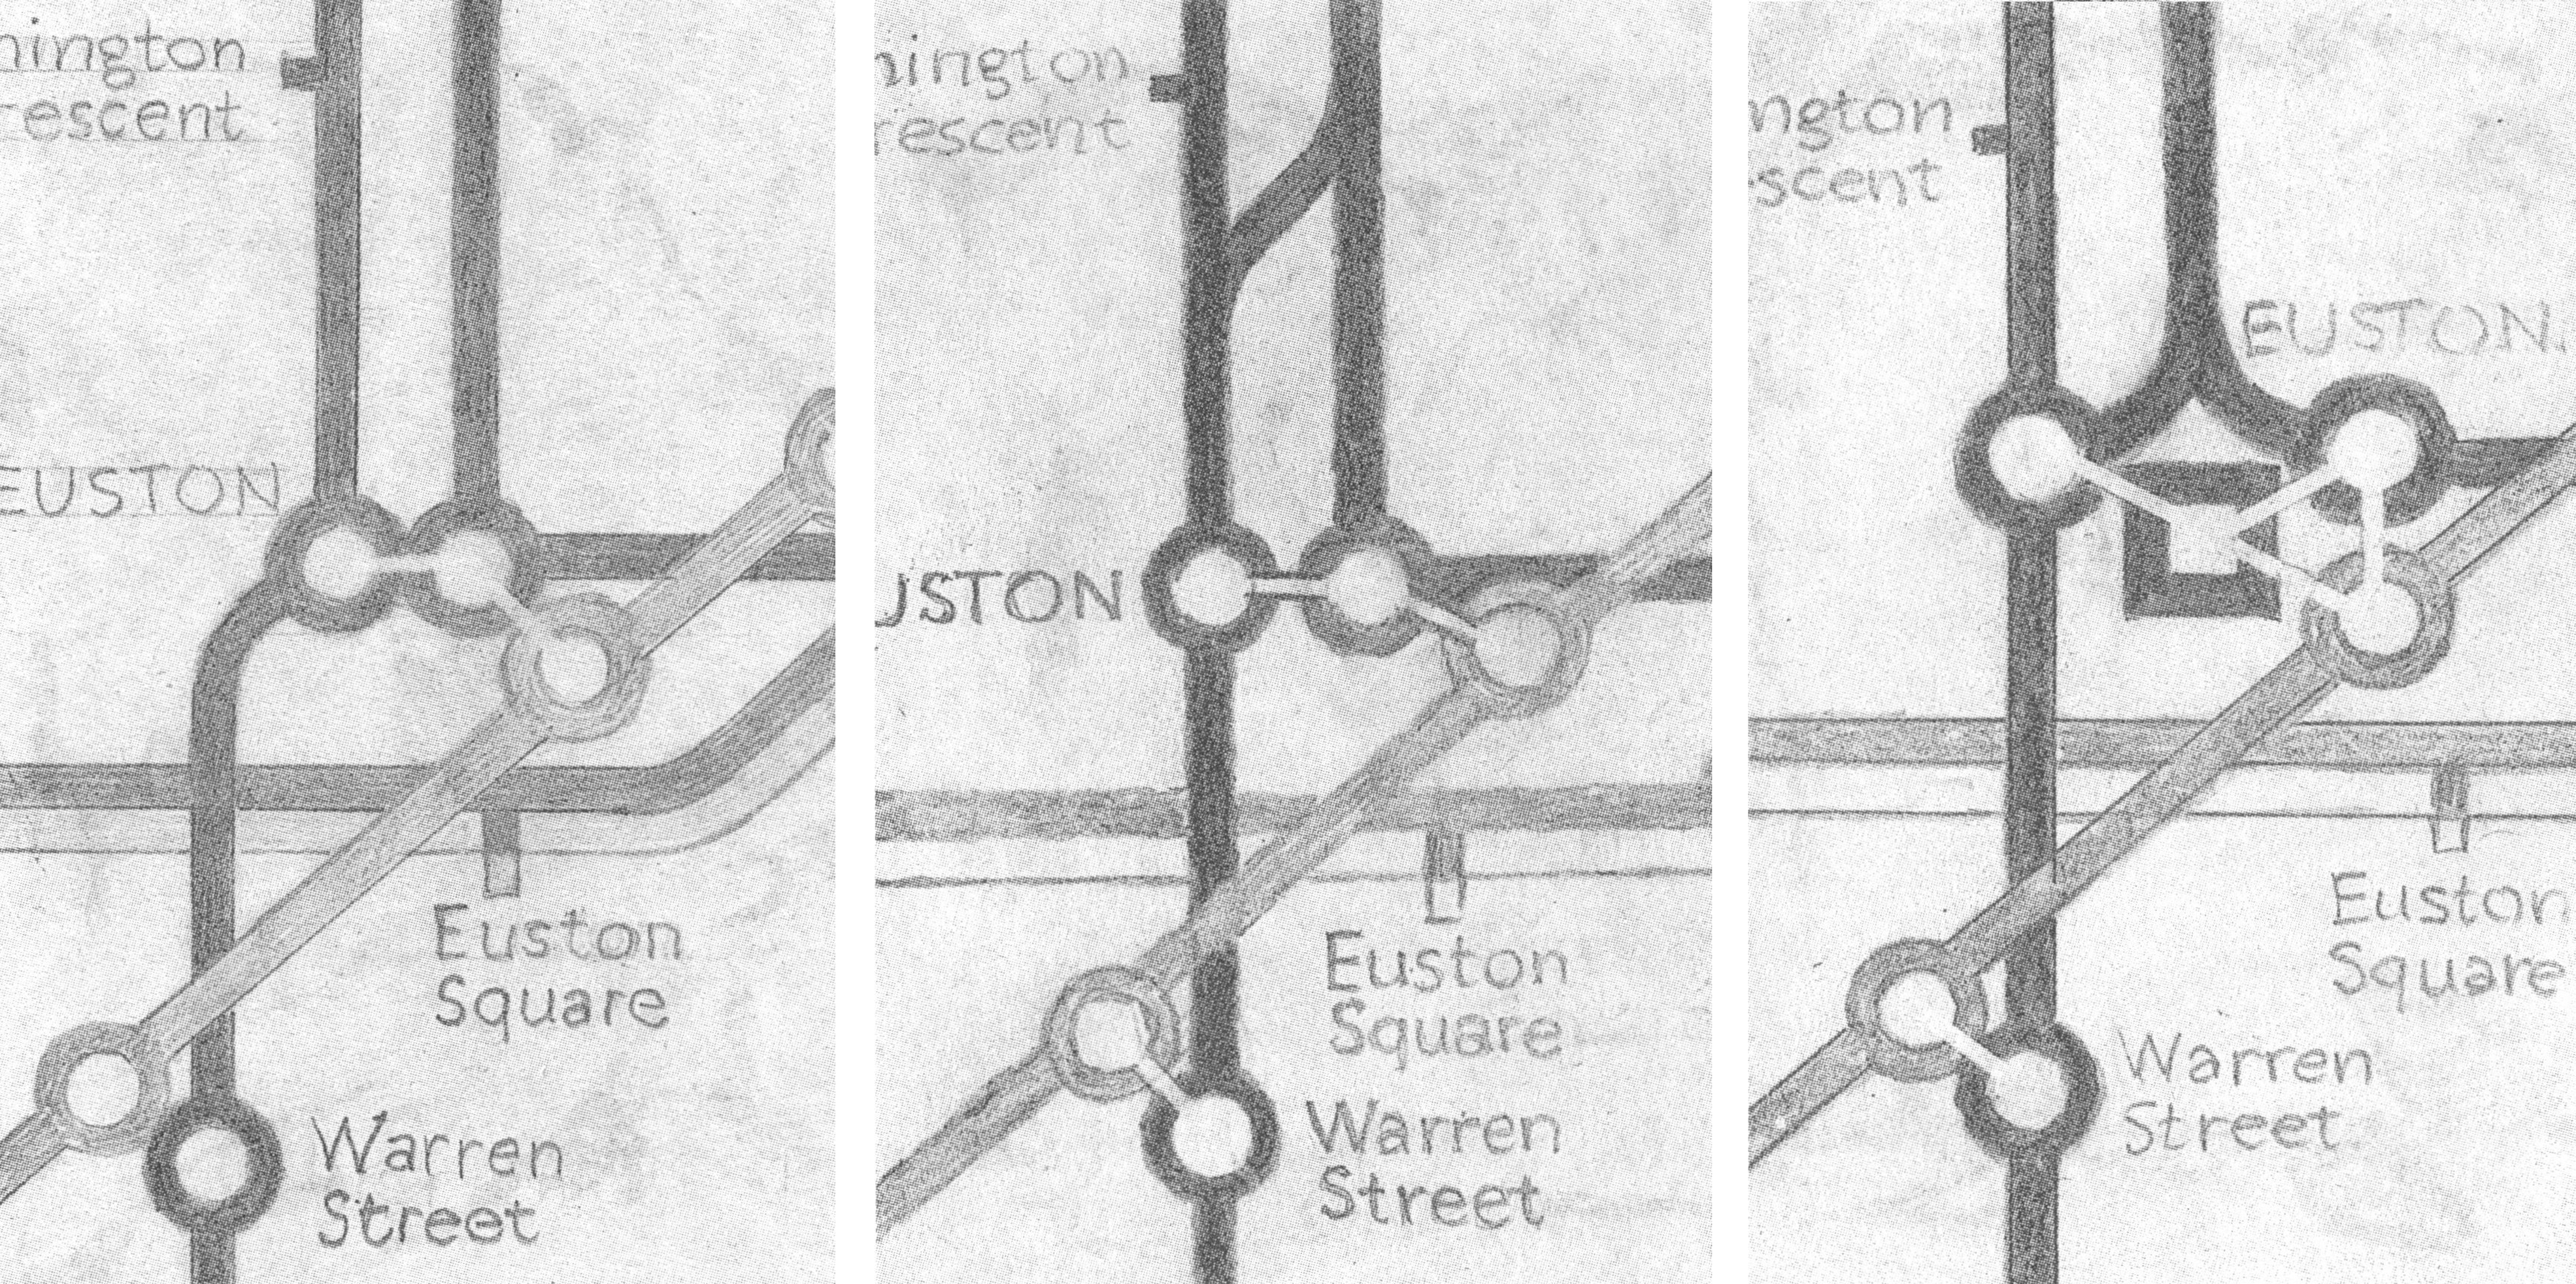
Fig. 13: Henry Charles Beck, pencil sketches on the topology of Euston and King’s Cross stations, 1961.53
The elderly Beck described his very practical theory of topological space as follows: “If you’re going underground, why do you need to bother about geography? It’s not so important. Connections are the thing.”54 Charles Holden’s station architectures and Frank Pick’s design guidelines strove for that kind of pragmatic aesthetics of connections, too. Stations were illuminated by special light installations as entry points to underground space. For the interior, Pick insisted on clear, indirect lights for the ceilings, therefore simplifying the passage to the platforms.55
The tactics of passengers and the smart changing of trains seem to be of transient nature when confronted with the strategies of drawn diagrams and architecture.56 The transitory mass ornament of traffic continues to be embodied by a number of anonymous individuals.57 We might concur with Marc Augé in saying that the experience of a subterranean train journey is rarely a collective one, although it happens in a shared space. The metro is not the place of synchronous mass traffic, despite the collective rules – no smoking, “passage interdit,” et cetera. Everyone individually celebrates his or her own parties and birthdays, the topography of liaisons, work, leisure, and so forth.58 In the common web of personal routes, each person takes part in the larger urban identity: community without celebration and loneliness without isolation, as Augé puts it. Meanwhile, the station names form a ritual sacrality of the metro as a lieu de mémoire (Platz der Luftbrücke, Bastille, Waterloo).59 The metropolis of the 1920s must be understood as an embodied sphere of circulation – a sphere in which the appropriation of new technologies forms a new culture of perception.60
Few historical documents have been able to grasp the specific everyday culture of moving through the netherworlds of the city. Silent witnesses like the newly introduced ticket vending machines of the 1920s counted passengers; statistics were meant to normalize their behavior. The introduction of common railway pictograms by the International Railway Union in 1932 reflects another trace of strategy.61 Finally, an action movie like Bulldog Jack (1935) does not tell of much entering, changing or disembarking of trains, but it transposes the passage itself into operation.62
Being part of a private-eye serial, Bulldog Jack presents an eight-minute, high-speed finale that develops a personal form of navigation along the line. Right at the moment when the film’s villain Morell escapes on a train with jewels from the British Museum, detective Bulldog Drummond and his friends attempt to stop him.63 While the hero brawls with Mr. Morell, his sidekick denotes the passed stations by putting a checkmark behind every name on the fictitious line (fig. 14): “Holden Brew – only four more stations! … White City – only three more! Ooooh! ! … Two more, two more! Ooooh! ! … Only one more! This is the end. Ooooh! ! We’re gonna crash, we’re gonna crash!”
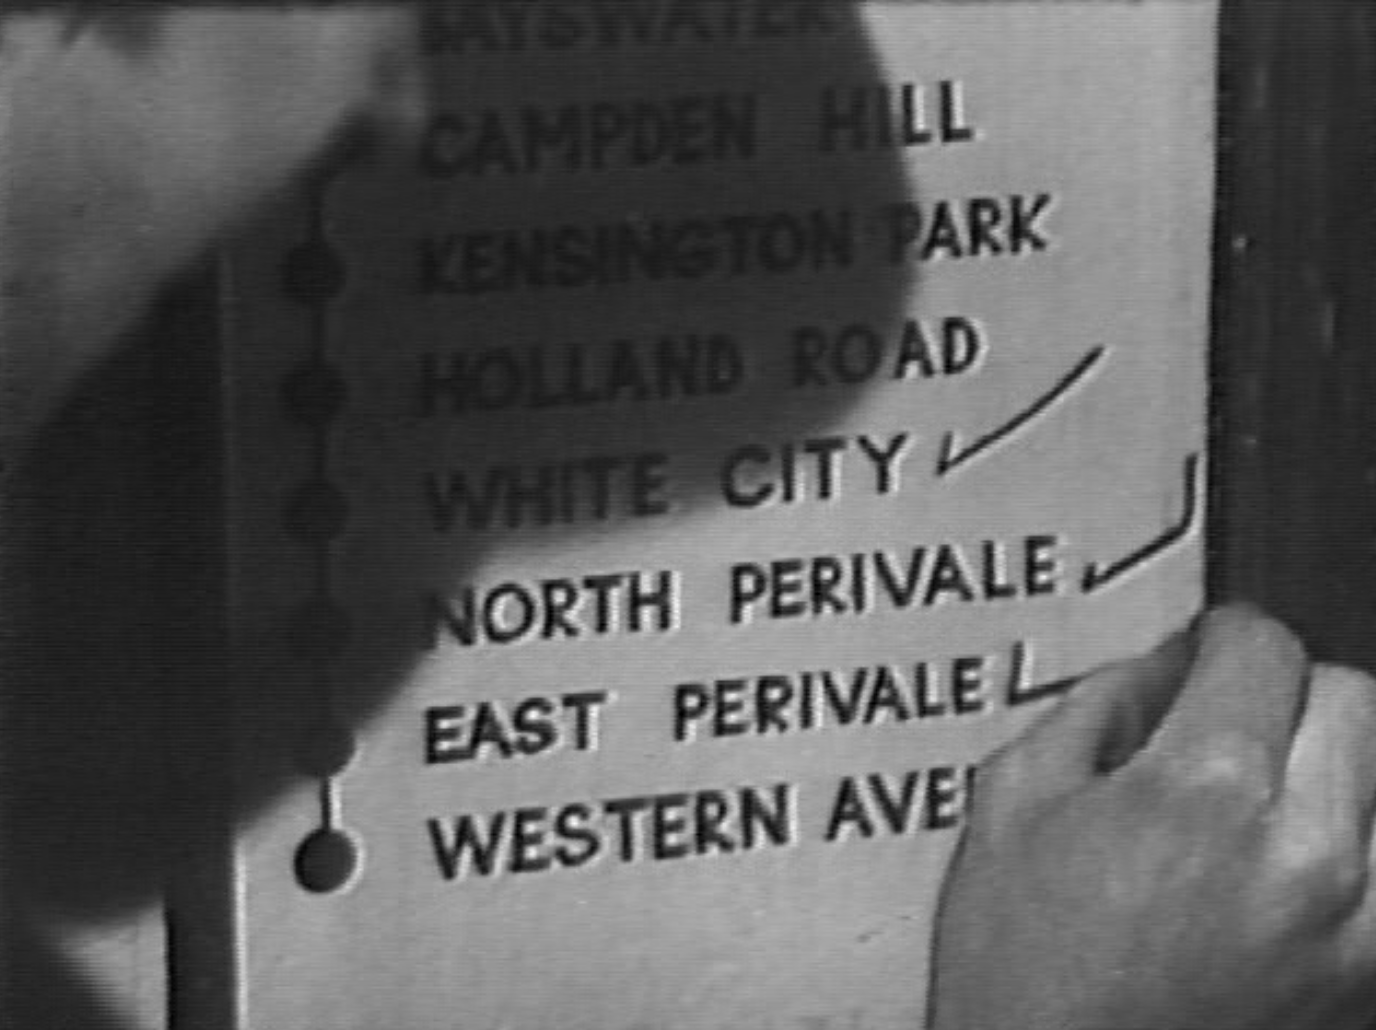
Fig. 14: Orientation along the line in Bulldog Jack, 1935. Digital film still from VHS video, 2007.64
This kind of relocalization becomes ever more prominent in the film, as the velocity gets higher and the cuts to station and tube architecture get shorter.
The characters of Bulldog Jack impersonate a new kind of urban passenger who must reorientate constantly. A big difference exists between nineteenth-century overland travels and the daily underground pathways.65 Riding the tube demands the active aisthesis of disappearance, which Paul Virilio has so genuinely portrayed.66 While the spatiotemporal paths between stations fade out, they return as the structural moment of an action film sequence. Within the moving images – just like in the railway control centers – the necessity for constant relocation is given. To paraphrase the words of Bernhard Siegert and Michel de Certeau: traveling on or with maps means a constant fissure between carte and parcours. This gap in addressing creates a temporal interval that calls for further timely synchronizations along the line and in the complete network. In the midst of architectural space, the passenger’s attention turns mainly to interchanges and temporalities of traffic.67
Strategies: Synchronization as a Governmental Interest; Electrical Grid and Railway Network
Is there a way to set up a state of political synchronization for the future? Above and beyond network timing via diagrams and technical apparatuses, the Tube Map also emerged in the context of a governmental decision.68 To counter the notorious asynchronicity of London traffic and British power supply, political stakeholders tried to move to state-centered forms of administration, a process starting with the electricity grid in 1926 and the London Transport facilities in 1931. The parallel centralization of metropolitan traffic and national power supply might be the most important political and economic background for the Tube Map.69
English railroads were always characterized by a multitude of independently run lines. The same was true for power supply and generating plants. In 1913, London had 65 plants, 32 different voltages for transmission, 24 for delivery and about 70 methods for measuring and accounting.70 The resulting problems were prosaically commented on: “The largest city in the world offers an excellent example of what electric supply ought not to be.”71 Within this jungle, the urban railroad companies decided to run their own power plants, as opposed to centrally run systems like in Berlin and Chicago.72 The national grid was initially designed to tackle those problems and was set up between 1930 and 1936.
Making the London metro part of an integrated traffic network also proved to be a longtime endeavor.73 By initiative of the Labour Minister of Transport Herbert Morrison (1888–1965), a bill for the establishment of the London Passenger Transport Board was put on the legislative agenda. Even after the fall of the Labour minority government, the bill ran through the parliamentary process until it was passed as an act. In the meantime, politicians tried to convince the owners of bus companies, railroads and tramlines to unite. The Railway Gazette issues that were published between 1930 and 1932 are full of reports on the complicated, nerve-stretching meetings headed by Lord Ashfield.74
My thesis is the following: the Tube Map proved to be politically useful, once it had become an instant part of public space. With the overdue centralization of infrastructure already in progress, its circulating copies presented a graphically unified network. This, however, was an unplanned coincidence. The diagram turned out to be also usable as an icon for perfect organization. Harry Beck’s sense for spatial navigation met the governmental interest: on July 1, 1933 the London Passenger Transport Board was officially inaugurated and put to work.75 At the same time, the Tube Map delivered a more regular pictorial representation of an electrical grid than all the graphics coming from the engineers of the national Central Electricity Board (CEB). Both infrastructures could only be ordered by state authority. Therefore, we should understand the Tube Map as a machine-like control diagram that also installed a mental map originating from the urban underground. It created and marked a space of clear and uncongested circulation. On the backside remained the uncontrollable bodies and objects, while the materiality of architecture surrounded all floating and halting traffic.76
London’s decentralized, networked railroad time and networked space had emergent yet disperse qualities that called for a synchronization and centralization of infrastructure. The Tube Map itself, while being a genuine design invention and an icon of electricity, was also a monument of municipal administration ideals for the optimal flow of passengers and goods.
Fig. 15: Lilian Dring, LPTB Modern God of Transport, ca. 1933. Draft for a poster triptych, 14.5 x 29.5 in.77
Yet this important change evoked a further artistic response that combined urban spatial network practices, the aesthetics of relationality and a sense for network history. In 1933, the graphic designer Lilian Dring offered Frank Pick a poster triptych (which was never printed, regrettably). It portrays the newly established London Passenger Transport Board in the body of Hermes as the “Modern God of Transport.” Antiquity’s messenger of the gods incorporates the roundel as his heart, Beck’s underground lines as arteries and veins, and the serpentine underground car as a snake around the god’s arms (fig. 15). Just like in Beck’s circuit mockery version of the Tube Map, Dring plays with the city’s landmarks: the mouth is represented by the BBC building, the ears by the Royal Albert Hall, the eyes by the National Gallery and the throat by the Tower Bridge. With this kind of urban self-description, the draftswoman has conjured the older traditions of urban communication that took corporeal blood circulation as a point of reference. These are combined with a constructivist setting of relations, which is so typical for Beck’s network aesthetics. These two historical strata are symbolically connected and transformed by Hermes; the reference to antiquity encompasses the reticular aesthetics of early modernity and also the geometric exactness of modernity. Dring’s poster calls for the deeper strata of the very long cultural history of networks to which our attention should turn.78 Even in high modernity, amidst the greatest “network fever,”79 material network archaeology profits from the irritation fostered by amodern practices and regimes of knowledge.
On Frank Pick’s biography, see Christian Barman, The Man Who Built London Transport: A Biography of Frank Pick (Newton Abbot, London, and North Pomfret: David & Charles, 1979); Oliver Green, Underground Art: London Transport Posters, 1908 to the Present, 2nd ed. (London: Laurence King Publishing, 2001), 8–9. On European cultural transfer, see Ulrike Weber, “Building the Tube: Zur Londoner Rezeption der Berliner U- und S-Bahnhöfe in den 1920er/30er Jahren,” in Berlin über und unter der Erde: Alfred Grenander, die U-Bahn und die Kultur der Metropole, ed. Aris Fioretos (Berlin: Nicolaische Verlagsbuchhandlung, 2006), 88–95. ↩
Ken Garland, Mr Beck’s Underground Map (Harrow Weld, Middlesex: Capital Transport Publishing, 1994), 16. ↩
See Beck’s statement in Garland, Mr Beck’s Underground Map, 17. ↩
Letter to Christian Barman, Publicity Office, June 2, 1938. See Garland, Mr Beck’s Underground Map, 32. ↩
Siegfried Kracauer called his present the “age of traffic” (Zeitalter des Verkehrs). This is poorly translated in the English version of The Salaried Masses as “age of travel.” Siegfried Kracauer, Die Angestellten: Aus dem neuesten Deutschland, suhrkamp taschenbuch wissenschaft 13 (Frankfurt am Main: Suhrkamp, 1971), 97. See Helmut Lethen, Verhaltenslehren der Kälte: Lebensversuche zwischen den Kriegen, edition suhrkamp 1884 (Frankfurt am Main: Suhrkamp, 1994), 44–45; Johannes Roskothen, Verkehr: Zu einer poetischen Theorie der Moderne (Munich: Fink, 2003), 44ff. ↩
Harry Beck in a talk with Ken Garland, retold by Garland in the BBC show Design Classics in 1994, quoted by Janin Hadlaw, “The London Underground Map: Imagining Modern Time and Space,” Design Issues 19, no. 1 (2003): 25–35, esp. 32 ↩
Ludwig Troske, Die Londoner Untergrundbahnen (Berlin: Julius Springer, 1892), 63. ↩
Garland, Mr Beck’s Underground Map, 19. ↩
Garland, Mr Beck’s Underground Map, 13. ↩
See Hadlaw, “The London Underground Map.” ↩
See Janet Vertesi, “Mind the Gap: The London Underground Map and Users’ Representation of Urban Space,” Social Studies of Science 38, no. 1 (2008): 7–33. ↩
See Paul Elliman, “Signal Failure,” in Else/Where: Mapping; New Cartographies of Networks and Territories, ed. Janet Abrams and Peter Hall (Minneapolis: University of Minnesota Press, 2006), 166–75, esp. 175 on the Tube Map’s status as icon of network efficienty and as a metaphor for an urban electrified machine. ↩
See Garland, Mr Beck’s Underground Map. On the general history of London Transport, see Theodore Cardwell Barker and Michael Robbins, A History of London Transport: Passenger Travel and the Development of the Metropolis, vol. II (London: George Allen & Unwin, 1974); Desmond Felix Croome and Alan Arthur Jackson, Rails through the Clay: A History of London’s Tube Railways (Harrow Weld, Middlesex: Capital Transport Publishing, 1993). A diagrammatic history of the network can be found in Douglas Rose, The London Underground: A Diagrammatic History, 7th ed. (Harrow Weld, Middlesex: Capital Transport Publishing, 2000). ↩
Garland, Mr Beck’s Underground Map, 25. ↩
Harry Beck describes this effect himself: “I tried to imagine that I was using a convex lens or mirror, so as to present the central area on a larger scale.” Garland, Mr Beck’s Underground Map, 17. ↩
See Richard Sennett, Flesh and Stone: The Body and the City in Western Civilization (New York, London, and Norton, 1994), 332–33. ↩
Just think of Cassirer’s work on the shift from substance to relation in Ernst Cassirer, “Substanzbegriff und Funktionsbegriff: Untersuchungen über die Grundfragen der Erkenntniskritik,” in Gesammelte Werke 6: Hamburger Ausgabe, ed. Birgit Recki (Hamburg: Meiner, 2000). ↩
See Green, Underground Art, 77 on Man Ray and Achim Borchardt-Hume, eds., Albers and Moholy-Nagy: From the Bauhaus to the New World (London: Tate Publications, 2006), 64. ↩
Borchardt-Hume, Albers and Moholy-Nagy, 58. ↩
Sarah Johnstone and Tom Masters, London City Guide (London: Lonely Planet Publications, 2006), 34. ↩
Nelson Goodman, Languages of Art: An Approach to a Theory of Symbols, 2nd ed. (1968; repr., Indianapolis: Hackett Publishing, 1976), 173–74. The relation of diagrammatics and topography is only approximately described by such an understanding. See the criticism in Bernhard Siegert, “Repräsentationen diskursiver Räume: Einleitung,” in Topographien der Literatur: Deutsche Literatur im transnationalen Kontext, ed. Hartmut Böhme (Stuttgart and Weimar: J.B. Metzler, 2005), 3–11, esp. 4. ↩
See Barker and Robbins, A History of London Transport, 352-353. ↩
See the early account “The Metropolitan Railway” by Henry Mayhew from the year 1865, in London Underground: Poems and Prose about the Tube, ed. Tobias Döring (Stuttgart: Reclam, 2003), 14–34, esp. 29–30. ↩
On the institutional backgrounds, see David Leboff and Tim Demuth, No Need to Ask! Early Maps of London’s Underground Railways (Harrow Weld, Middlesex: Capital Transport Publishing, 1999), 44. On the iconography of the logo, see Barker and Robbins, A History of London Transport, 179. ↩
First cut in 1916. See Garland, Mr Beck’s Underground Map, 21. ↩
See Garland, Mr Beck’s Underground Map, 68ff. ↩
Charles Baudelaire, “Le Cygne/Der Schwan,” in Sämtliche Werke in 8 Bänden, vol. 3 (1857; repr., Frankfurt am Main: Zweitausendeins, 1995), 226–31, esp. 228. ↩
See Elliman, “Signal Failure,” 172. ↩
Anonymous, “Centralised Control of Railway Traffic,” The Railway Gazette and Railway News, January 22, 1932, 106–7 and 115. ↩
Anonymous, “Centralised Control of Railway Traffic,” 107. ↩
Signalling on the Ealing and Shepherd’s Bush Railway, 1921. London Transport Museum, Film Collection, No. 121. ↩
London Transport Museum, Film Collection, No. 121. ↩
See John Pattinson Thomas, Handling London’s Underground Traffic (London: London’s Underground, 1928), 83. ↩
On train signals and shunting as examples of mechanical feedback, see Norbert Wiener, Cybernetics or Control and Communication in the Animal and the Machine, 2nd ed. (Cambridge, MA: MIT, 1965), 98. Many thanks to Lasse Scherffig for this hint. ↩
Thomas, Handling London’s Underground Traffic, 58. ↩
Thomas, Handling London’s Underground Traffic, 55-56. ↩
Thomas, Handling London’s Underground Traffic, 82–83. ↩
Thomas, Handling London’s Underground Traffic, 53. ↩
Thomas, Handling London’s Underground Traffic, 74-75. ↩
Thomas, Handling London’s Underground Traffic, 73. ↩
Thomas, Handling London’s Underground Traffic, 61, 86. ↩
Thomas, Handling London’s Underground Traffic, 97. ↩
Thomas, Handling London’s Underground Traffic, 97. ↩
Thomas, Handling London’s Underground Traffic, 98. ↩
See Peter Galison, Einstein’s Clocks, Poincarés Maps (New York and London: Norton & Company, 2003), 98–99. ↩
Marc Augé, Un ethnologue dans le métro, 2nd ed. (Paris: Hachette, 2002), 45. Translation by the author. ↩
Thomas, Handling London’s Underground Traffic, 100. ↩
Thomas, Handling London’s Underground Traffic, 101. ↩
See Croome and Jackson, Rails through the Clay, 154. ↩
The right and wrong way to board an electric train, 1920. London Transport Museum, Film Collection, No. 125. The film was distributed by Gaumont. ↩
Thomas, Handling London’s Underground Traffic, 31. On connectivitiy and interconnectivity, see Hartmut Böhme, “Netzwerke: Zur Theorie und Geschichte einer Konstruktion,” in Netzwerke: Eine Kulturtechnik der Moderne, ed. Jürgen Barkhoff, Hartmut Böhme, and Jeanne Riou (Cologne: Böhlau, 2004), 17–36, esp. 19. ↩
Barker and Robbins, A History of London Transport, 288-289. ↩
Garland, Mr Beck’s Underground Map, 71. ↩
Hadlaw, “The London Underground Map,” 32. ↩
See Thomas, Handling London’s Underground Traffic, 170–71. ↩
On urban passenger tactics, see Stefan Höhne, “Token Tactics: Artefaktpolitiken in der New Yorker City Subway,” in Versorgung und Entsorgung der Moderne: Logistiken und Infrastrukturen der 1920er und 1930er Jahre, ed. Wiebke Porombka, Heinz Reif, and Erhard Schütz (Frankfurt am Main et al.: Peter Lang, 2011), 73–87. ↩
In reference to Siegfried Kracauer, see Roskothen, Verkehr, 77. ↩
See Augé, Un ethnologue dans le métro, 45. ↩
See Augé, Un ethnologue dans le métro, 45, 54. ↩
See Roskothen, Verkehr, 83. ↩
See Anonymous, “Public Notes on Railways,” Railway Gazette, January 8, 1932, 44–45. ↩
Walter Ford (director), Bulldog Jack, UK 1935. VHS, 1994. ↩
In Bulldog Jack the stock character of the serial happens to be impersonated by another person pretending to be Bulldog Drummond while he is really Bulldog “Jack.” ↩
Bulldog Jack, Walter Ford et al., UK 1935. ↩
See Wolfgang Schivelbusch, The Railway Journey: The Industrialization of Time and Space in the 19th Century (1977; repr., Leamington Spa and New York: Berg, 1986). ↩
On the deliberate forgetting of passage, see Paul Virilio, The Aesthetics of Disappearance (Los Angeles: Semiotext(e), 2009), 19–20. ↩
Siegert, “Repräsentationen diskursiver Räume,” 10. See Vertesi, “Mind the Gap,” 13–14, on the multitude of contemporary orientation practices with the Tube Map. ↩
German Police decrees of the 1920s also put emphasis on the synchronization of individual and collective movement. See Dirk van Laak, “Just in Time: Zur Theorie von Infrastruktur und Logistik,” in Versorgung und Entsorgung der Moderne: Logistiken und Infrastrukturen der 1920er und 1930er Jahre, ed. Wiebke Porombka, Heinz Reif, and Erhard Schütz (Frankfurt am Main et al.: Peter Lang, 2011), 13–23, esp. 17. ↩
On the poetology of the British grid, see James Purdon’s “Electric Cinema, Pylon Poetry” in this issue of Amodern: https://amodern.net/article/electric-cinema-pylon-poetry/ ↩
See London County Council: Report on Electricity Supply, prepared by Merz & McLellan, London 1914, app. 2, 37–38, and Thomas Parkes Hughes, Networks of Power: Electrification in Western Society 1880–1930 (Baltimore and London: Johns Hopkins University Press, 1983), 227. ↩
Anonymous, “Electrical Development in England,” Electrical World 82 (1923): 1056. London encompassed 4.7 million inhabitants at that time. ↩
On London Transport’s Lots Road power station, see Hughes, Networks of Power, 232. See also Croome and Jackson, Rails through the Clay, 75, and Elliman, “Signal Failure,” 167. London Transport therefore escaped the complex problems of an electrical grid on a national scale. The hardly computable synchronizations of the grid are what led Vannevar Bush to build an analogue “network analyzer” computer at MIT. See Hughes, Networks of Power, 376. ↩
See the sketch for a “penny transport” in the Railway Gazette, March 25, 1932, 459–61. ↩
See Railway Gazette, e.g., in the editions May 8 and 15, 1931. For a detailed account, see Barker and Robbins, A History of London Transport, 272–73. ↩
The first institutional annual report was published in 1934. See First Annual Report and Statement of Accounts and Statistics for the Year ended 30 June 1934 (London Passenger Transport Board, 1934), London Transport Museum Library, Quick Reference. In Berlin, Ernst Reuter managed to inaugurate a similar organization as “Berliner Verkehrsbetriebe” (BVG) on January 1, 1929. See Heinz Reif, “Verkehrsnetze und Großstadtentwicklung: Ernst Reuters und Martin Wagners Vision der Weltstadt Berlin 1925 bis 1933,” in Versorgung und Entsorgung der Moderne: Logistiken und Infrastrukturen der 1920er und 1930er Jahre, ed. Wiebke Porombka, Heinz Reif, and Erhard Schütz (Frankfurt am Main et al.: Peter Lang, 2011), 53–71, esp. 56–57. ↩
Here I am following a thesis put forth by Johannes Roskothen. See Roskothen, Verkehr, 67. ↩
Green, Underground Art, 78. ↩
See Sebastian Gießmann, Die Verbundenheit der Dinge: Eine Kulturgeschichte der Netze und Netzwerke (Berlin: Kadmos, 2014), http://prezi.com/-txljg78gr_v/die-verbundenheit-der-dinge, and Sebastian Gießmann, Netze und Netzwerke: Archäologie einer Kulturtechnik 1740–1840 (Bielefeld: transcript, 2006). ↩
See Mark Wigley, “Network Fever,” Grey Room 4 (2001): 82–122. ↩
Article: Creative Commons Attribution-ShareAlike 3.0 Unported License
http://creativecommons.org/licenses/by-sa/3.0/
Image: "Introduction: Paragraph 10”
From: "Drawings from A Thousand Plateaus"
Original Artist: Marc Ngui
https://amodern.net/artist-profile-marc-ngui/
Copyright: Marc Ngui